The Return of Large Carnivores and Extensive Farming Systems: A Review of Stakeholders' Perception at an EU Level
- PMID: 34200713
- PMCID: PMC8229100
- DOI: 10.3390/ani11061735
The Return of Large Carnivores and Extensive Farming Systems: A Review of Stakeholders' Perception at an EU Level
Abstract
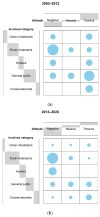
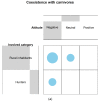
Conflicts between large carnivores and human activities undermine both the maintenance of livestock practices as well as the conservation of carnivores across Europe. Because large carnivore management is driven by a common EU policy, the purpose of this research was to assess stakeholders' perception towards bears and wolves at an EU level. We conducted a systematic search and subsequent analysis of 40 peer-reviewed studies collected from 1990 to September 2020 within Member States of the EU. Rural inhabitants and hunters exhibited the most negative attitude compared to urban inhabitants and conservationists, whose attitude was more positive. We showed that direct experience with predators as a consequence of ongoing re-colonization may have affected the degree of acceptance of certain categories and that the long-term coexistence between humans and carnivores does not necessarily imply increased tolerance. To encourage coexistence, we recommend monitoring changes in attitudes over time relative to carnivore population dynamics.
Keywords: European Union; coexistence; human–carnivore conflict; livestock system; predator.
Conflict of interest statement
No conflict of interest is reported by the authors.
Figures


Similar articles
-
Managing conflict between large carnivores and livestock.Conserv Biol. 2018 Feb;32(1):26-34. doi: 10.1111/cobi.12959. Epub 2017 Jul 5. Conserv Biol. 2018. PMID: 28556528 Review.
-
A meta-analysis of studies on attitudes toward bears and wolves across Europe 1976-2012.Conserv Biol. 2015 Apr;29(2):565-74. doi: 10.1111/cobi.12420. Epub 2014 Nov 20. Conserv Biol. 2015. PMID: 25412113
-
Transitioning towards human-large carnivore coexistence in extensive grazing systems.Ambio. 2020 Dec;49(12):1982-1991. doi: 10.1007/s13280-020-01340-w. Epub 2020 May 8. Ambio. 2020. PMID: 32385811 Free PMC article.
-
Living with wolves: A worldwide systematic review of attitudes.Ambio. 2024 Oct;53(10):1414-1432. doi: 10.1007/s13280-024-02036-1. Epub 2024 Jun 4. Ambio. 2024. PMID: 38833186 Free PMC article.
-
Carnivore Management Zones and their Impact on Sheep Farming in Norway.Environ Manage. 2019 Nov;64(5):537-552. doi: 10.1007/s00267-019-01212-4. Epub 2019 Oct 17. Environ Manage. 2019. PMID: 31624855 Free PMC article.
Cited by
-
Niche partitioning and individual specialisation in resources and space use of sympatric fur seals at their range margin.Oecologia. 2024 Apr;204(4):815-832. doi: 10.1007/s00442-024-05537-8. Epub 2024 Apr 3. Oecologia. 2024. PMID: 38568471 Free PMC article.
-
Shepherds View of Large Carnivore Recovery in the Pyrenees, Spain.Animals (Basel). 2023 Jun 23;13(13):2088. doi: 10.3390/ani13132088. Animals (Basel). 2023. PMID: 37443885 Free PMC article.
References
-
- Battaglini L., Bovolenta S., Gusmeroli F., Salvador S., Sturaro E. Environmental Sustainability of Alpine Livestock Farms. Ital. J. Anim. Sci. 2014;13:3155. doi: 10.4081/ijas.2014.3155. - DOI
-
- Pachoud C., Da Re R., Ramanzin M., Bovolenta S., Gianelle D., Sturaro E. Tourists and Local Stakeholders’ Perception of Ecosystem Services Provided by Summer Farms in the Eastern Italian Alps. Sustainability. 2020;12:1095. doi: 10.3390/su12031095. - DOI
-
- Plieninger T., Schleyer C., Schaich H., Ohnesorge B., Gerdes H., Hernández-Morcillo M., Bieling C. Mainstreaming ecosystem services through reformed European agricultural policies. Conserv. Lett. 2012;5:281–288. doi: 10.1111/j.1755-263X.2012.00240.x. - DOI
-
- Antrop M. Landscape change and the urbanization process in Europe. Landsc. Urban Plan. 2004;67:9–26. doi: 10.1016/S0169-2046(03)00026-4. - DOI
Publication types
LinkOut - more resources
Full Text Sources

