. 2021 Jun 10;18(12):6303.
doi: 10.3390/ijerph18126303.

Occupational Heat Stress: Multi-Country Observations and Interventions

Affiliations

Occupational Heat Stress: Multi-Country Observations and Interventions

Leonidas G Ioannou et al. Int J Environ Res Public Health. .

Abstract

Background: Occupational heat exposure can provoke health problems that increase the risk of certain diseases and affect workers' ability to maintain healthy and productive lives. This study investigates the effects of occupational heat stress on workers' physiological strain and labor productivity, as well as examining multiple interventions to mitigate the problem.

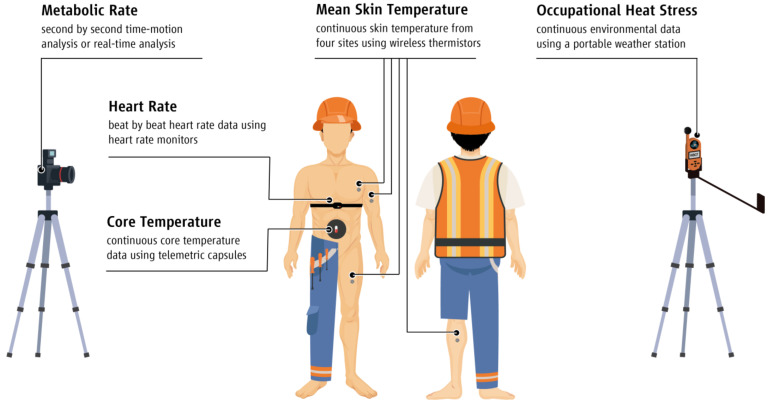
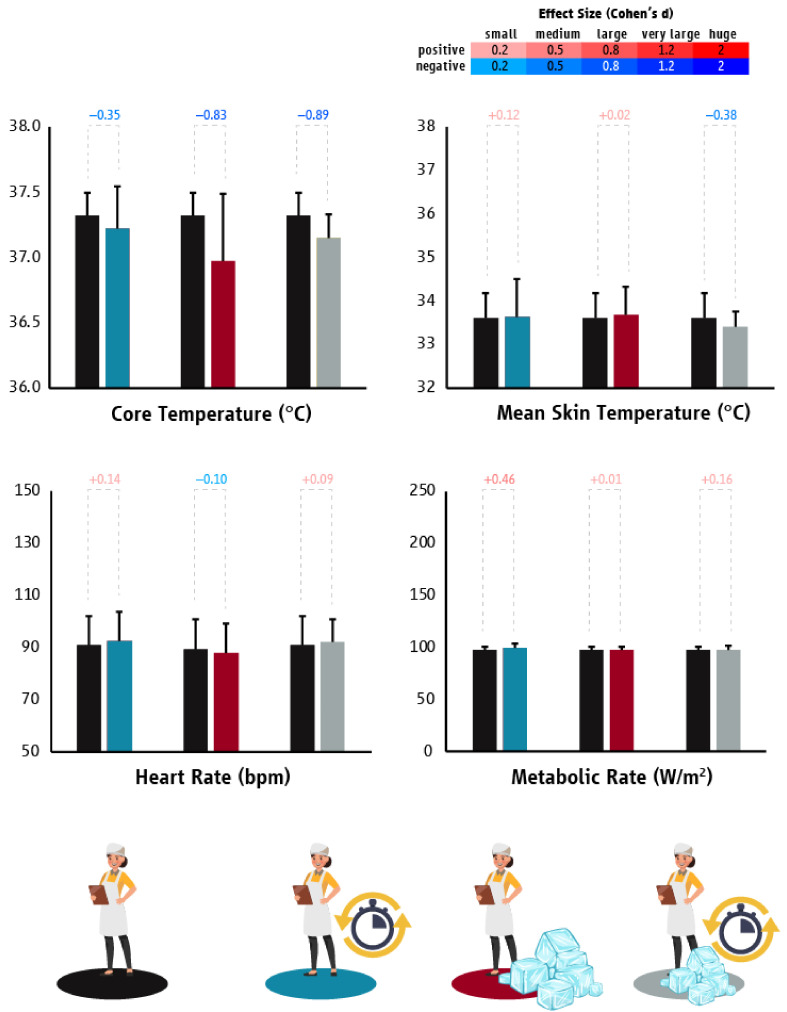
Methods: We monitored 518 full work-shifts obtained from 238 experienced and acclimatized individuals who work in key industrial sectors located in Cyprus, Greece, Qatar, and Spain. Continuous core body temperature, mean skin temperature, heart rate, and labor productivity were collected from the beginning to the end of all work-shifts.

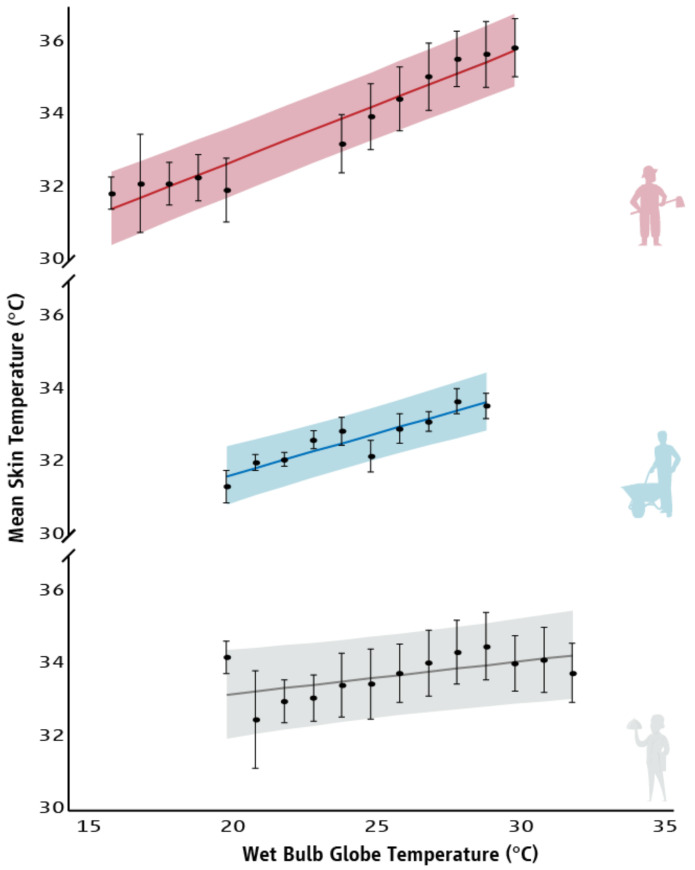
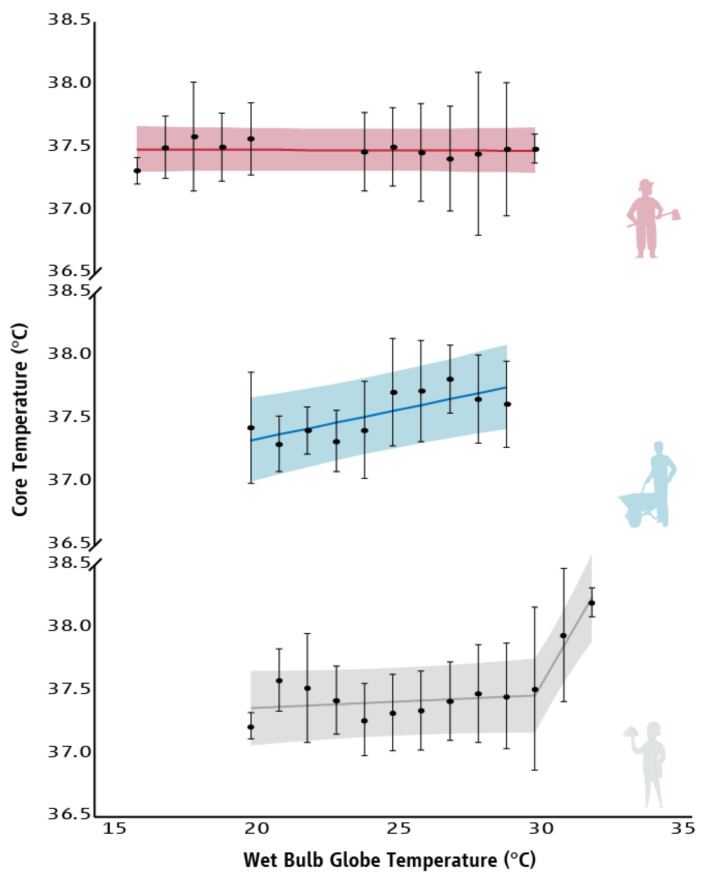
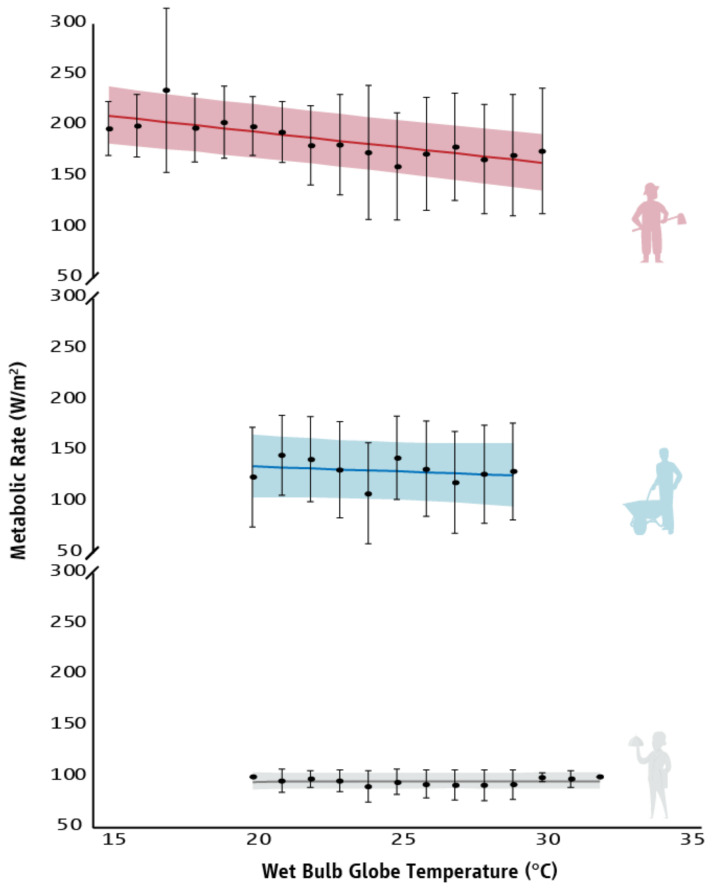
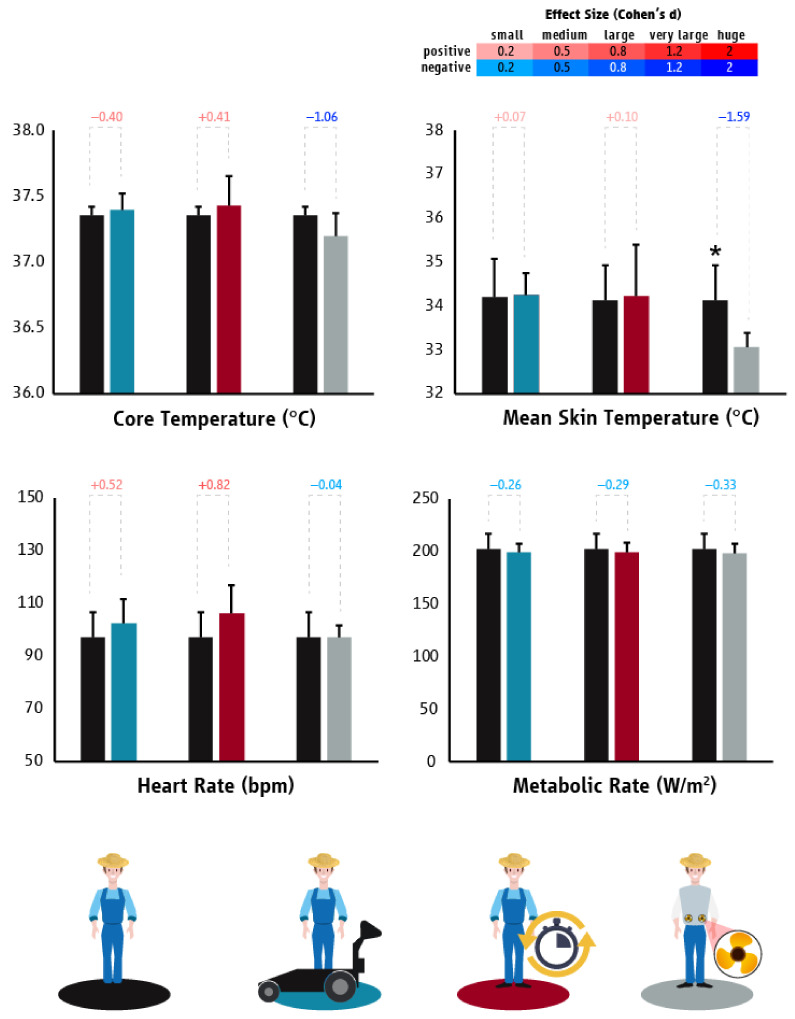
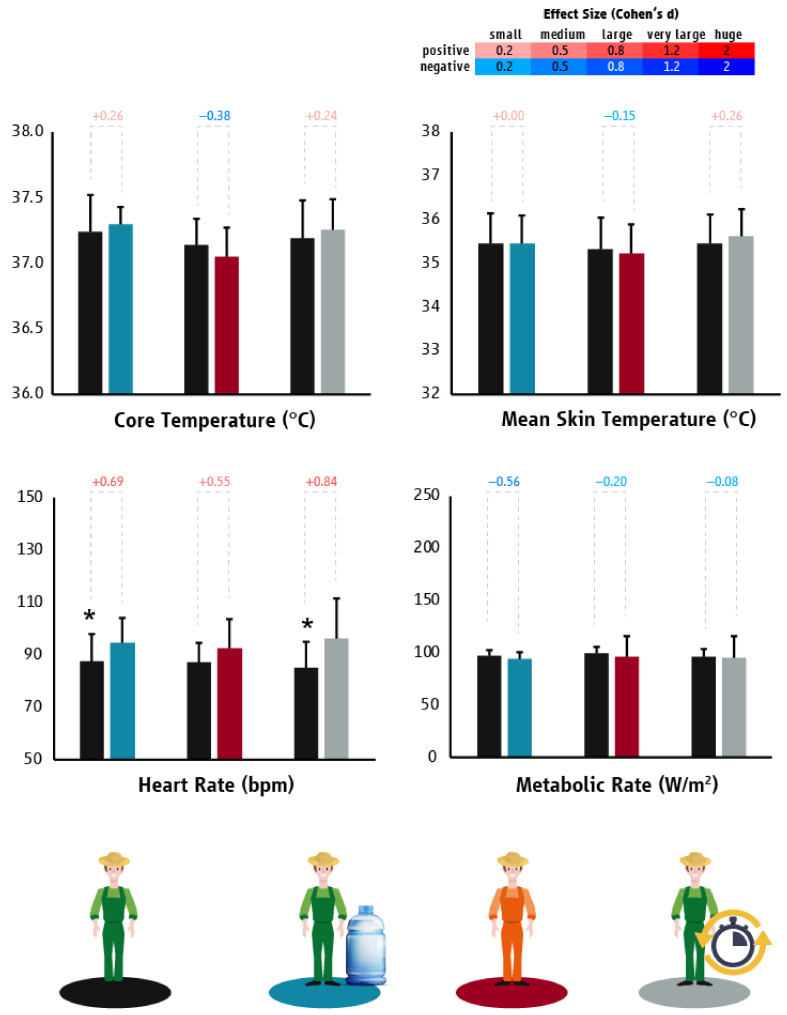
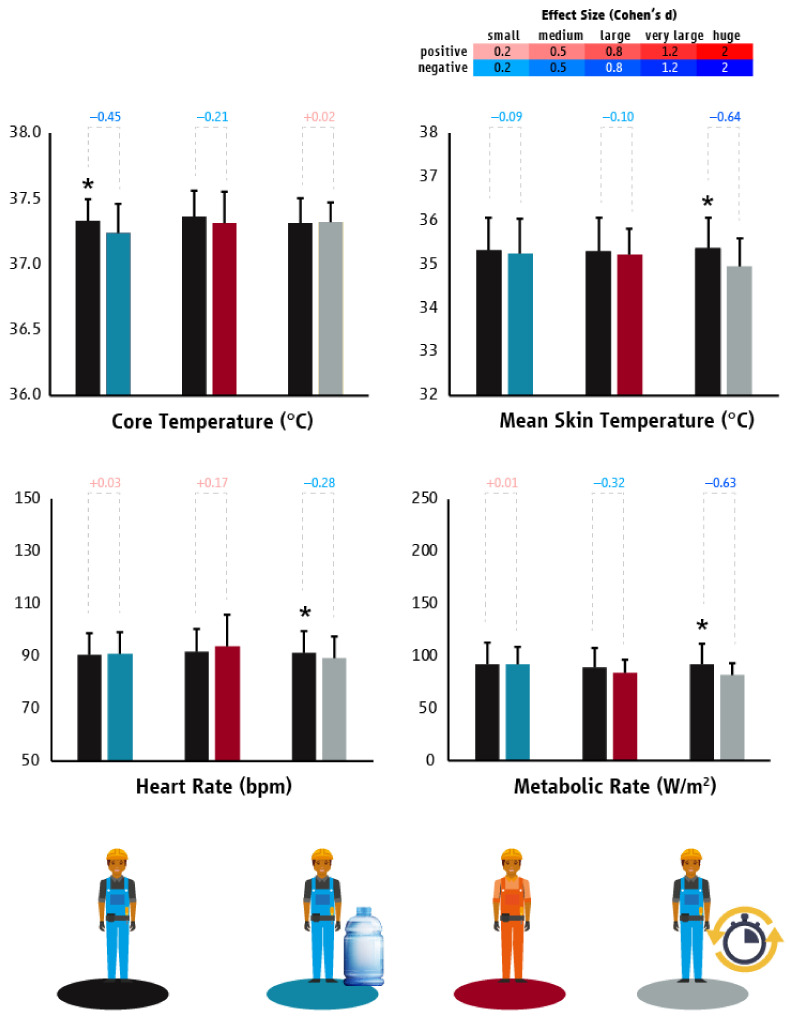
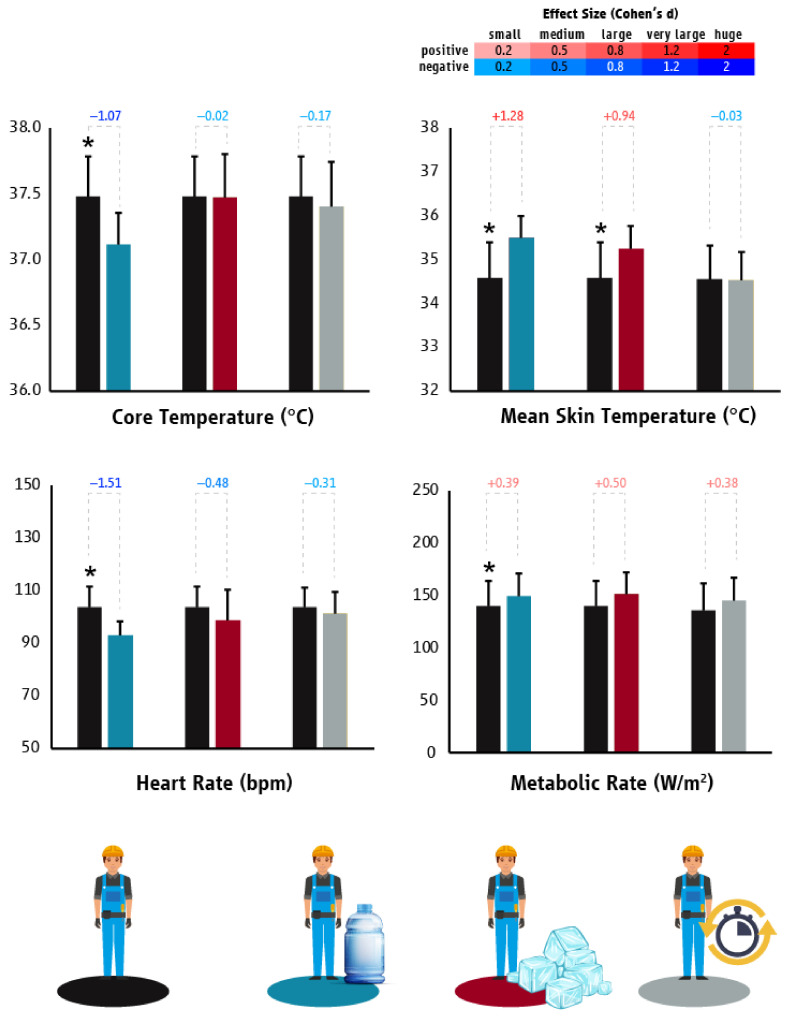
Results: In workplaces where self-pacing is not feasible or very limited, we found that occupational heat stress is associated with the heat strain experienced by workers. Strategies focusing on hydration, work-rest cycles, and ventilated clothing were able to mitigate the physiological heat strain experienced by workers. Increasing mechanization enhanced labor productivity without increasing workers' physiological strain.

Conclusions: Empowering laborers to self-pace is the basis of heat mitigation, while tailored strategies focusing on hydration, work-rest cycles, ventilated garments, and mechanization can further reduce the physiological heat strain experienced by workers under certain conditions.

Keywords: breaks; heat stress; hydration; ice slurry; labor productivity; mechanization; mitigation; physiological strain; ventilated garments; work.


Conflict of interest statement

The authors declare no conflict of interest.

Figures

Figure 1
Figure 1
Data collection throughout the experiments.
Figure 2
Figure 2
Relationship between Wet-Bulb Globe Temperature and the mean skin temperature (average ± SD) of people who work in agriculture (red), construction (blue), and tourism (grey) sectors. Lines represent the slope of the predicted relationship between Wet-Bulb Globe Temperature and the mean skin temperature of workers. Shadings correspond to the 95% prediction intervals of the means.
Figure 3
Figure 3
Relationship between Wet-Bulb Globe Temperature and the core temperature (average ± SD) of people who work in agriculture (red), construction (blue), and tourism (grey) sectors. Lines represent the slope of the predicted relationship between Wet-Bulb Globe Temperature and the core temperature of workers. Shadings correspond to the 95% prediction intervals of the means.
Figure 4
Figure 4
Relationship between Wet-Bulb Globe Temperature and the metabolic rate/work intensity (average ± SD) of people who work in agriculture (red), construction (blue), and tourism (grey) sectors. Lines represent the slope of the predicted relationship between Wet-Bulb Globe Temperature and the metabolic rate/work intensity of workers. Shadings correspond to the 95% prediction intervals of the means.
Figure 5
Figure 5
Differences (mean ± SD) in core temperature, mean skin temperature, heart rate, and metabolic rate/work intensity between “business as usual” and the tested heat mitigation strategies in the agriculture sector of Cyprus. Black, light blue, red, and grey colors represent “business as usual”, mechanical fruit cart, planned breaks, and ventilated garments scenarios, respectively. Asterisk indicates statistically significant difference between “business as usual” and the tested heat mitigation strategy. Cohen’s d effect sizes show the magnitude (small: 0.2; medium: 0.5; large: 0.8; very large: 1.2; huge: 2.0) and direction (positive: shades of red; negative: shades of blue) of the differences between “business as usual” and the tested heat mitigation strategies.
Figure 6
Figure 6
Differences (mean ± SD) in core temperature, mean skin temperature, heart rate, and metabolic rate/work intensity between “business as usual” and the tested heat mitigation strategies in the agriculture sector of Qatar. Black, light blue, red, and grey colors represent “business as usual”, hydration, evaporative garments, and planned breaks scenarios, respectively. Asterisks indicate statistically significant differences between “business as usual” and the tested heat mitigation strategies. Cohen’s d effect sizes show the magnitude (small: 0.2; medium: 0.5; large: 0.8; very large: 1.2; huge: 2.0) and direction (positive: shades of red; negative: shades of blue) of the differences between “business as usual” and the tested heat mitigation strategies.
Figure 7
Figure 7
Differences (mean ± SD) in core temperature, mean skin temperature, heart rate, and metabolic rate/work intensity between “business as usual” and the tested heat mitigation strategies in the construction sector of Qatar. Black, light blue, red, and grey colors represent “business as usual”, hydration, evaporative garments, and planned breaks scenarios, respectively. Asterisks indicate statistically significant differences between “business as usual” and the tested heat mitigation strategies. Cohen’s d effect sizes show the magnitude (small: 0.2; medium: 0.5; large: 0.8; very large: 1.2; huge: 2.0) and direction (positive: shades of red; negative: shades of blue) of the differences between “business as usual” and the tested heat mitigation strategies.
Figure 8
Figure 8
Differences (mean ± SD) in core temperature, mean skin temperature, heart rate, and metabolic rate/work intensity between “business as usual” and the tested heat mitigation strategies in the construction sector of Spain. Black, light blue, red, and grey colors represent “business as usual”, hydration, ice slurry, and planned breaks scenarios, respectively. Asterisks indicate statistically significant differences between “business as usual” and the tested heat mitigation strategies. Cohen’s d effect sizes show the magnitude (small: 0.2; medium: 0.5; large: 0.8; very large: 1.2; huge: 2.0) and direction (positive: shades of red; negative: shades of blue) of the differences between “business as usual” and the tested heat mitigation strategies.
Figure 9
Figure 9
Differences (mean ± SD) in core temperature, mean skin temperature, heart rate, and metabolic rate/work intensity between “business as usual” and the tested heat mitigation strategies in the tourism sector of Greece. Black, light blue, red, and grey colors represent “business as usual”, planned breaks, ice slurry, and “combined” (two minutes of planned break combined with ice slurry consumption (2.4 g per body mass kilogram) every hour of continuous work) scenarios, respectively. Cohen’s d effect sizes show the magnitude (small: 0.2; medium: 0.5; large: 0.8; very large: 1.2; huge: 2.0) and direction (positive: shades of red; negative: shades of blue) of the differences between “business as usual” and the tested heat mitigation strategies.

References

    1. Piil J.F., Lundbye-Jensen J., Christiansen L., Ioannou L., Tsoutsoubi L., Dallas C.N., Mantzios K., Flouris A.D., Nybo L. High prevalence of hypohydration in occupations with heat stress—Perspectives for performance in combined cognitive and motor tasks. PLoS ONE. 2018;13:e0205321. doi: 10.1371/journal.pone.0205321. - DOI - PMC - PubMed
    1. Tawatsupa B., Yiengprugsawan V., Kjellstrom T., Berecki-Gisolf J., Seubsman S.-A., Sleigh A. Association between heat stress and occupational injury among Thai workers: Findings of the Thai Cohort Study. Ind. Health. 2013;51:34–46. doi: 10.2486/indhealth.2012-0138. - DOI - PubMed
    1. Page L., Sheppard S. Heat Stress: The Impact of Ambient Temperature on Occupational Injuries in the US. Department of Economics Working Papers; Williamstown, MA, USA: 2016.
    1. Varghese B.M., Hansen A., Bi P., Pisaniello D. Are workers at risk of occupational injuries due to heat exposure? A comprehensive literature review. Saf. Sci. 2018;110:380–392. doi: 10.1016/j.ssci.2018.04.027. - DOI
    1. Zander K.K., Botzen W.J., Oppermann E., Kjellstrom T., Garnett S.T. Heat stress causes substantial labour productivity loss in Australia. Nat. Clim. Chang. 2015;5:647. doi: 10.1038/nclimate2623. - DOI

Publication types