Single-Cell RNA-Seq Reveals Transcriptomic Heterogeneity and Post-Traumatic Osteoarthritis-Associated Early Molecular Changes in Mouse Articular Chondrocytes
- PMID: 34200880
- PMCID: PMC8230441
- DOI: 10.3390/cells10061462
Single-Cell RNA-Seq Reveals Transcriptomic Heterogeneity and Post-Traumatic Osteoarthritis-Associated Early Molecular Changes in Mouse Articular Chondrocytes
Abstract
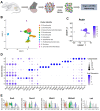
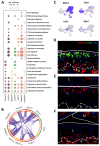
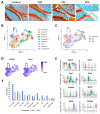
Articular cartilage is a connective tissue lining the surfaces of synovial joints. When the cartilage severely wears down, it leads to osteoarthritis (OA), a debilitating disease that affects millions of people globally. The articular cartilage is composed of a dense extracellular matrix (ECM) with a sparse distribution of chondrocytes with varying morphology and potentially different functions. Elucidating the molecular and functional profiles of various chondrocyte subtypes and understanding the interplay between these chondrocyte subtypes and other cell types in the joint will greatly expand our understanding of joint biology and OA pathology. Although recent advances in high-throughput OMICS technologies have enabled molecular-level characterization of tissues and organs at an unprecedented resolution, thorough molecular profiling of articular chondrocytes has not yet been undertaken, which may be in part due to the technical difficulties in isolating chondrocytes from dense cartilage ECM. In this study, we profiled articular cartilage from healthy and injured mouse knee joints at a single-cell resolution and identified nine chondrocyte subtypes with distinct molecular profiles and injury-induced early molecular changes in these chondrocytes. We also compared mouse chondrocyte subpopulations to human chondrocytes and evaluated the extent of molecular similarity between mice and humans. This work expands our view of chondrocyte heterogeneity and rapid molecular changes in chondrocyte populations in response to joint trauma and highlights potential mechanisms that trigger cartilage degeneration.
Keywords: PTOA; cartilage; chondrocyte heterogeneity; gene expression; knee injury; osteoarthritis; scRNA-seq.
Conflict of interest statement
The authors declare no conflict of interest.
Figures


Similar articles
-
Anti-Inflammatory Therapeutic Approaches to Prevent or Delay Post-Traumatic Osteoarthritis (PTOA) of the Knee Joint with a Focus on Sustained Delivery Approaches.Int J Mol Sci. 2021 Jul 27;22(15):8005. doi: 10.3390/ijms22158005. Int J Mol Sci. 2021. PMID: 34360771 Free PMC article. Review.
-
Single-cell RNA sequencing reveals different chondrocyte states in femoral cartilage between osteoarthritis and healthy individuals.Front Immunol. 2024 May 29;15:1407679. doi: 10.3389/fimmu.2024.1407679. eCollection 2024. Front Immunol. 2024. PMID: 38868774 Free PMC article.
-
Global Gene Expression Analysis Identifies Age-Related Differences in Knee Joint Transcriptome during the Development of Post-Traumatic Osteoarthritis in Mice.Int J Mol Sci. 2020 Jan 6;21(1):364. doi: 10.3390/ijms21010364. Int J Mol Sci. 2020. PMID: 31935848 Free PMC article.
-
Chaperonin 60 regulation of SOX9 ubiquitination mitigates the development of knee osteoarthritis.J Mol Med (Berl). 2016 Jul;94(7):755-69. doi: 10.1007/s00109-016-1422-3. Epub 2016 Apr 27. J Mol Med (Berl). 2016. PMID: 27118120
-
Impact of Abnormal Mechanical Stress on Chondrocyte Death in Osteoarthritis.Med Sci Monit. 2025 Jun 10;31:e948290. doi: 10.12659/MSM.948290. Med Sci Monit. 2025. PMID: 40493524 Free PMC article. Review.
Cited by
-
Anti-Inflammatory Therapeutic Approaches to Prevent or Delay Post-Traumatic Osteoarthritis (PTOA) of the Knee Joint with a Focus on Sustained Delivery Approaches.Int J Mol Sci. 2021 Jul 27;22(15):8005. doi: 10.3390/ijms22158005. Int J Mol Sci. 2021. PMID: 34360771 Free PMC article. Review.
-
Single-cell RNA sequencing analysis of human chondrocytes reveals cell-cell communication alterations mediated by interactive signaling pathways in osteoarthritis.Front Cell Dev Biol. 2023 Apr 4;11:1099287. doi: 10.3389/fcell.2023.1099287. eCollection 2023. Front Cell Dev Biol. 2023. PMID: 37082621 Free PMC article.
-
Progress in multi-omics studies of osteoarthritis.Biomark Res. 2025 Feb 11;13(1):26. doi: 10.1186/s40364-025-00732-y. Biomark Res. 2025. PMID: 39934890 Free PMC article. Review.
-
GDF8 inhibition enhances musculoskeletal recovery and mitigates posttraumatic osteoarthritis following joint injury.Sci Adv. 2023 Dec;9(48):eadi9134. doi: 10.1126/sciadv.adi9134. Epub 2023 Nov 29. Sci Adv. 2023. PMID: 38019905 Free PMC article.
-
Elucidating mechano-pathology of osteoarthritis: transcriptome-wide differences in mechanically stressed aged human cartilage explants.Arthritis Res Ther. 2021 Aug 16;23(1):215. doi: 10.1186/s13075-021-02595-8. Arthritis Res Ther. 2021. PMID: 34399844 Free PMC article.
References
Publication types
MeSH terms
Grants and funding
LinkOut - more resources
Full Text Sources
Molecular Biology Databases

