Review
. 2021 Jun 8;13(6):1968.
doi: 10.3390/nu13061968.

A Comprehensive Review of Almond Clinical Trials on Weight Measures, Metabolic Health Biomarkers and Outcomes, and the Gut Microbiota

Affiliations
Review

A Comprehensive Review of Almond Clinical Trials on Weight Measures, Metabolic Health Biomarkers and Outcomes, and the Gut Microbiota

Mark L Dreher. Nutrients. .

Abstract

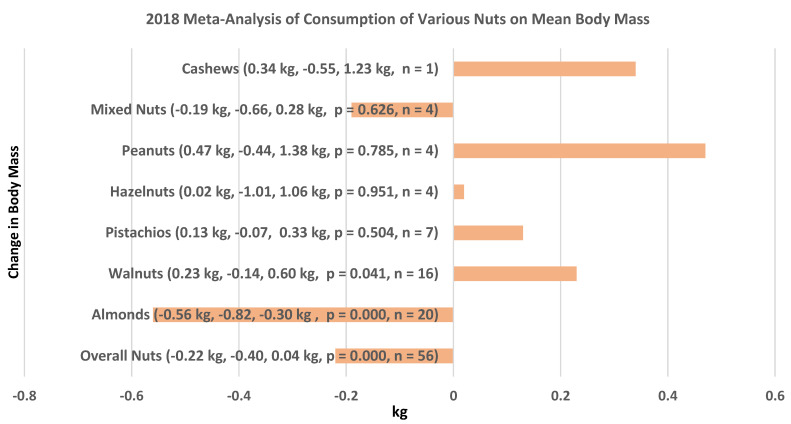
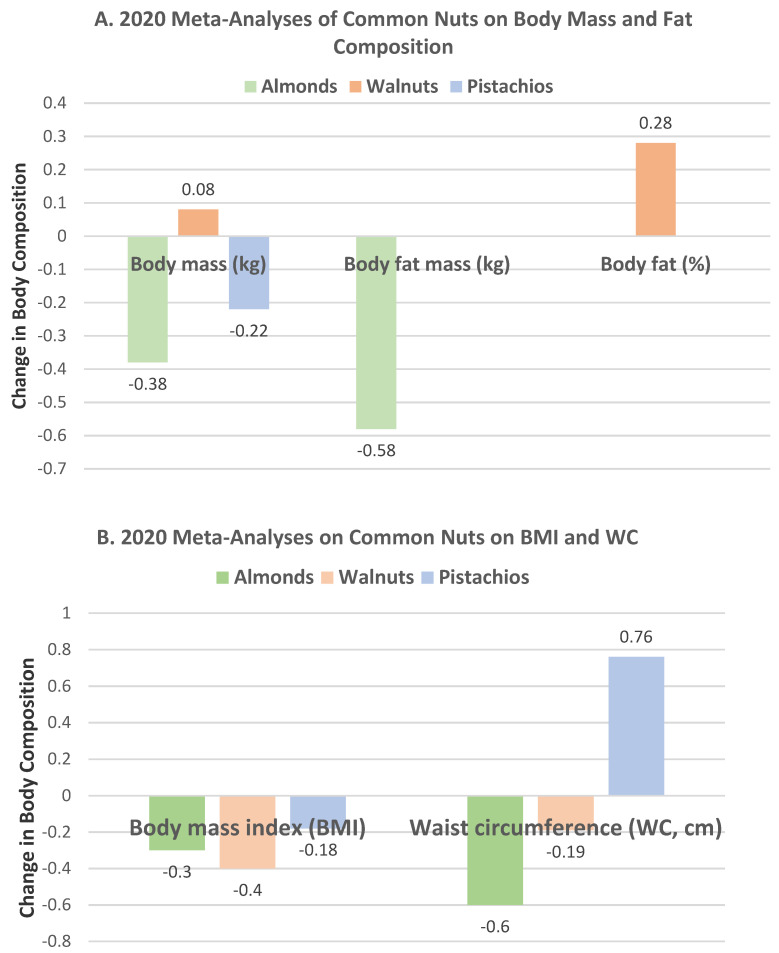
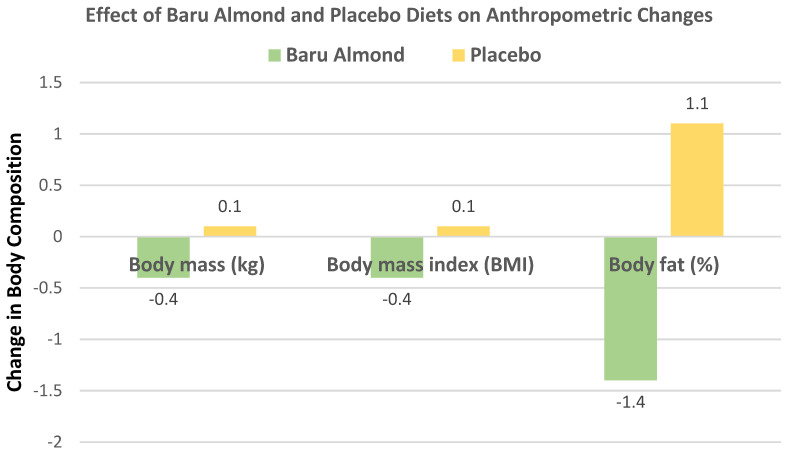
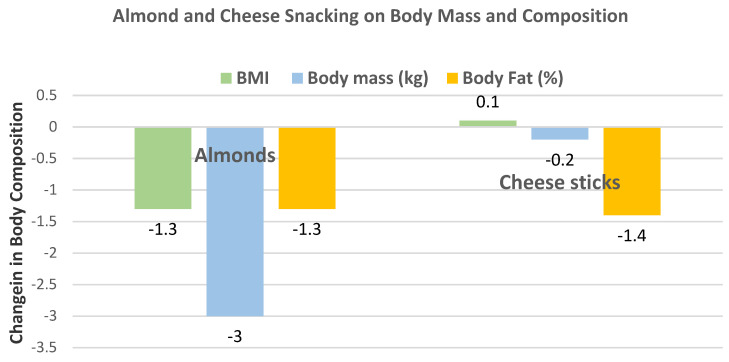
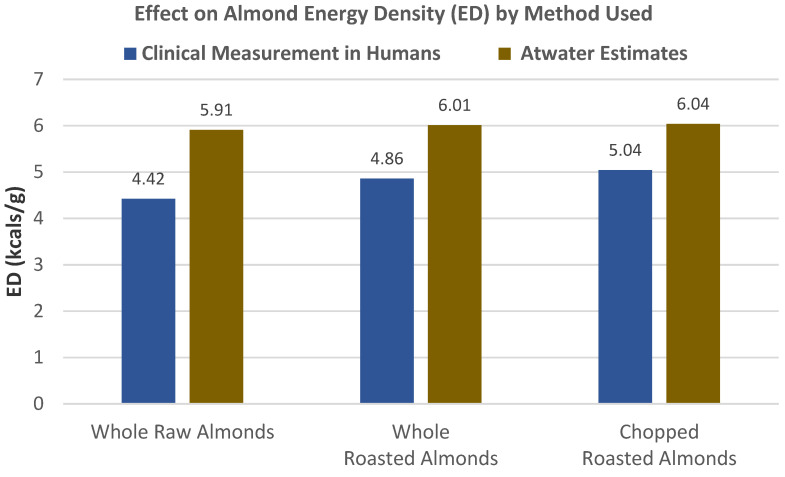
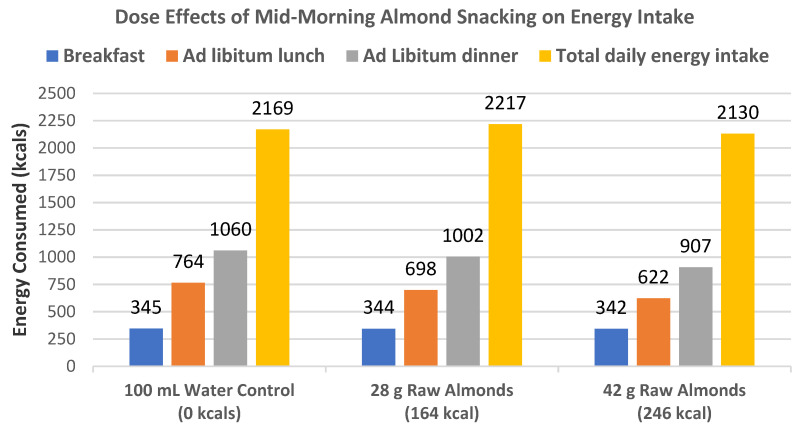
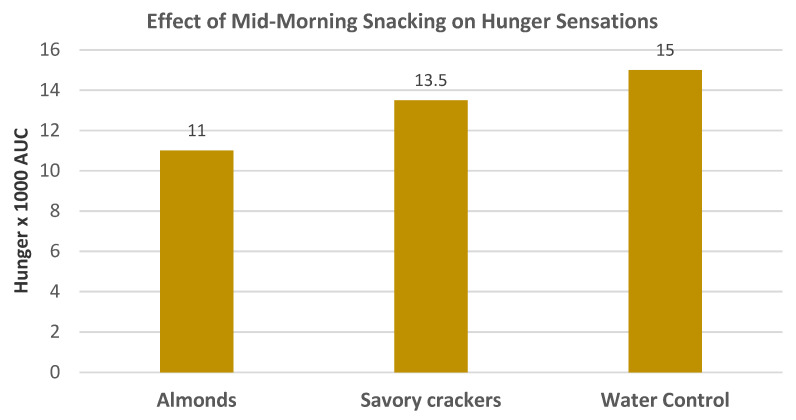
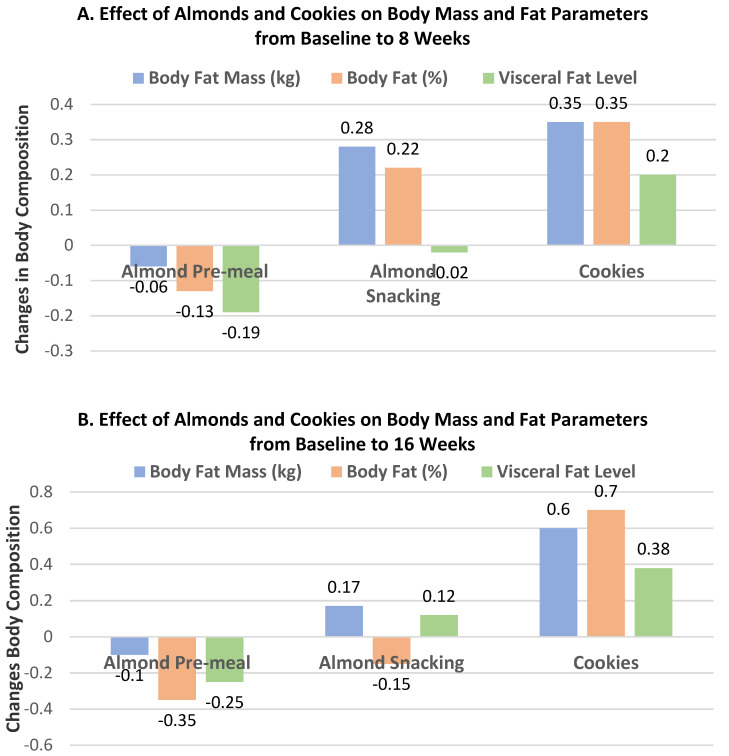
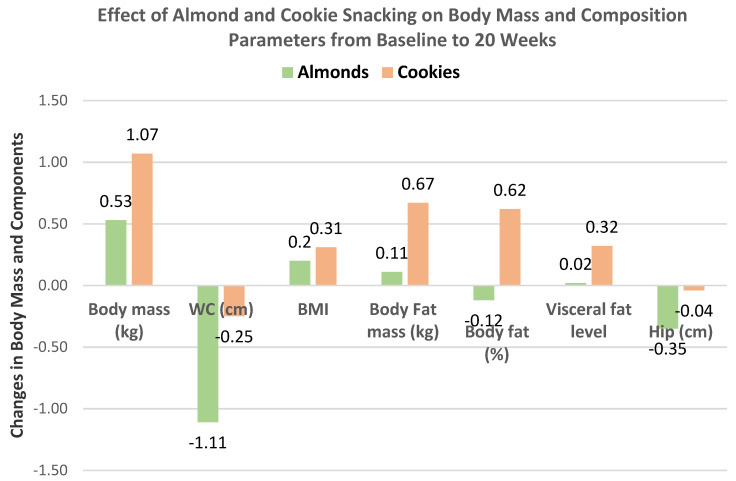
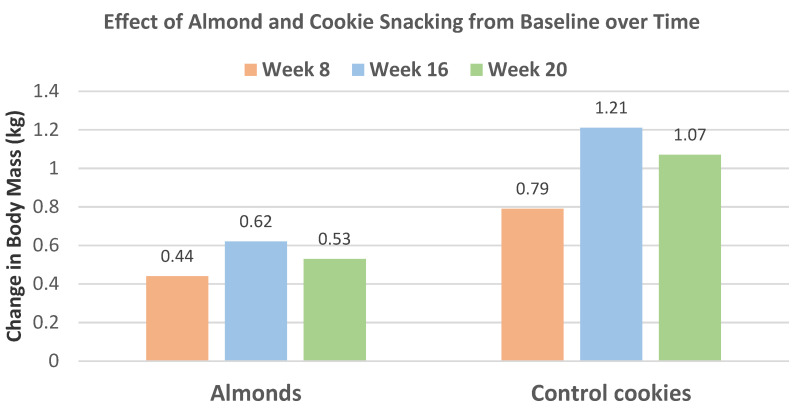
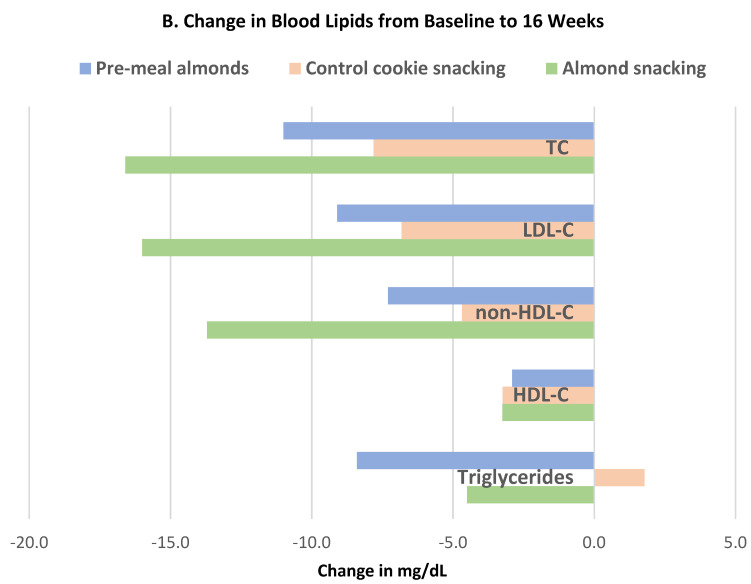
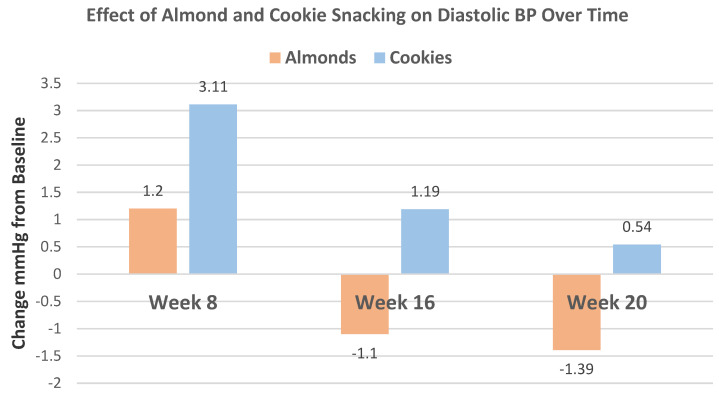
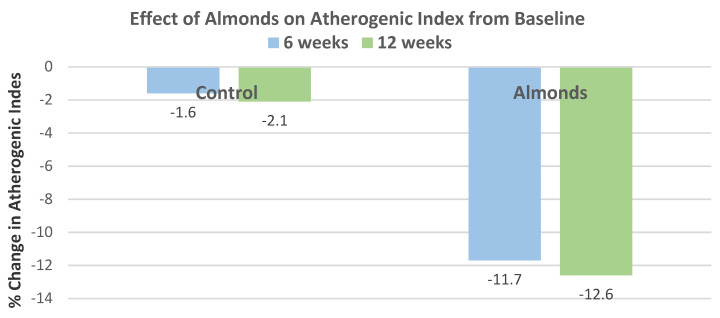
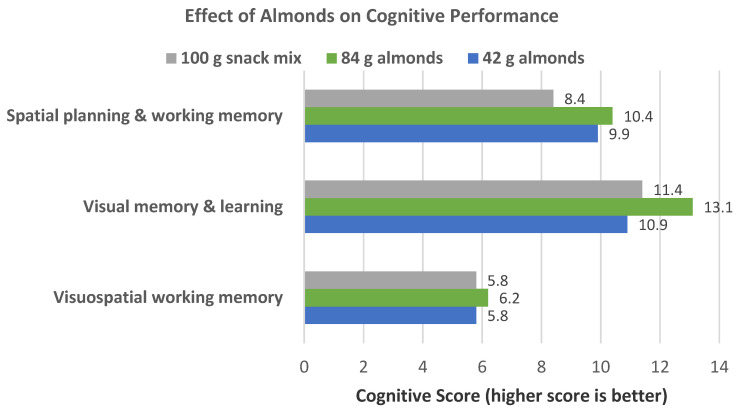
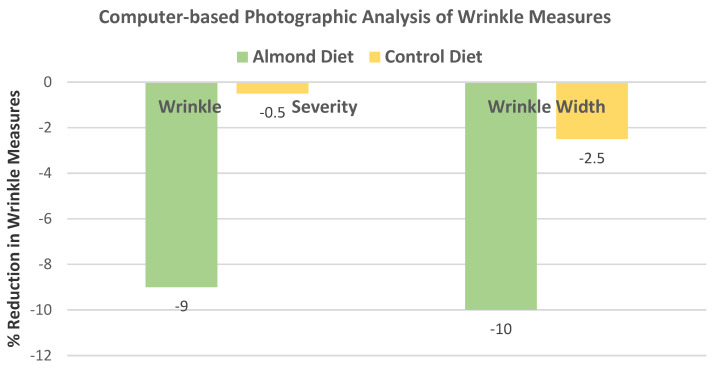
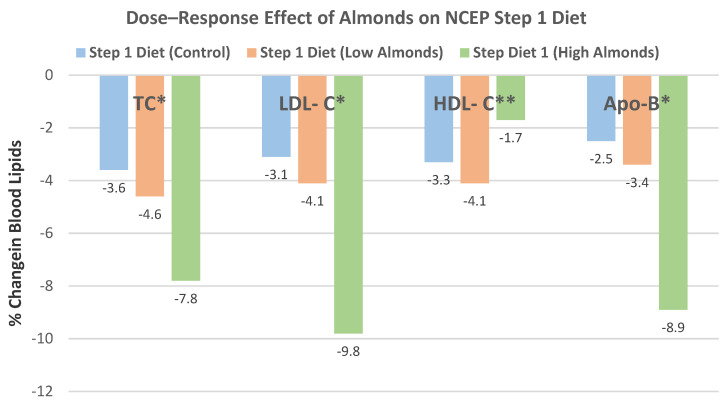
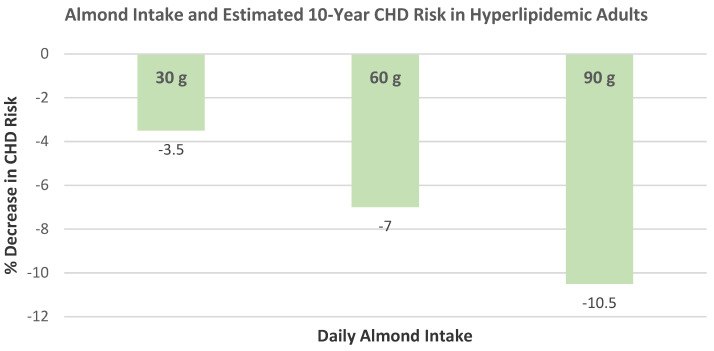
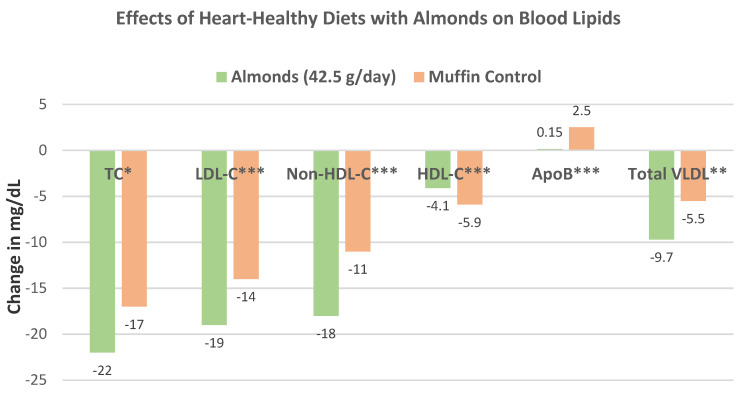
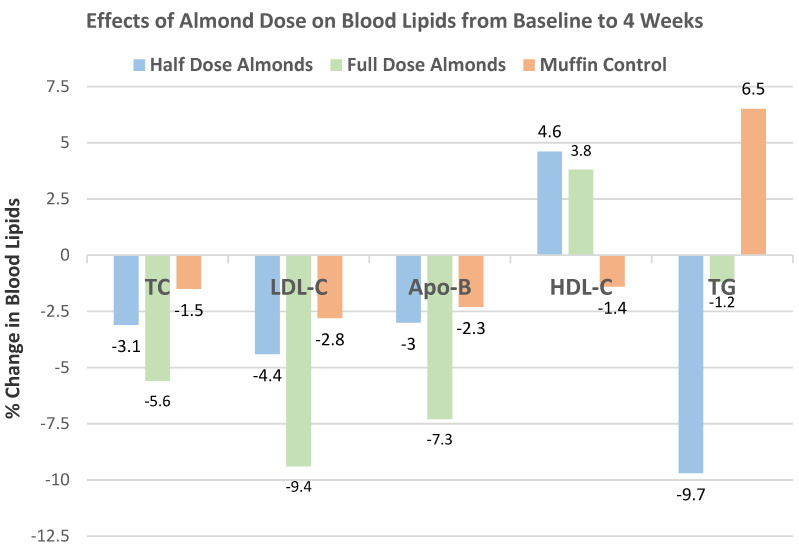
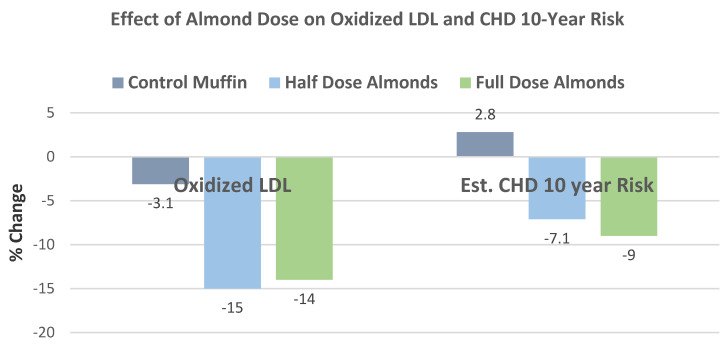
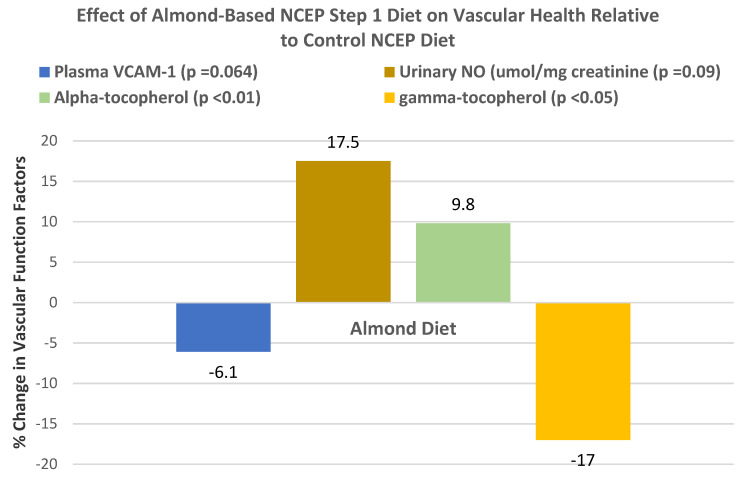
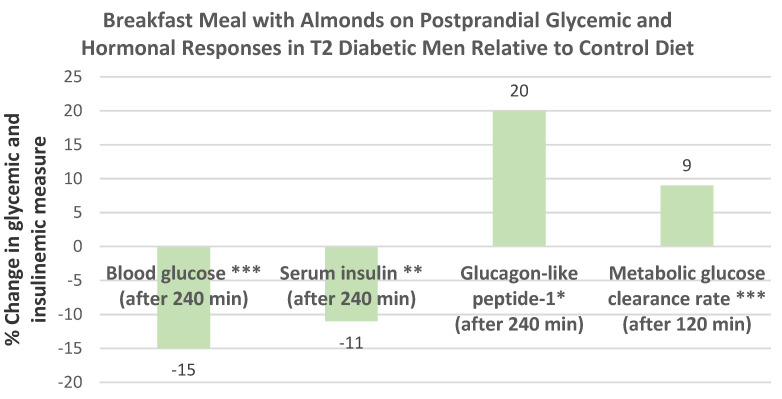
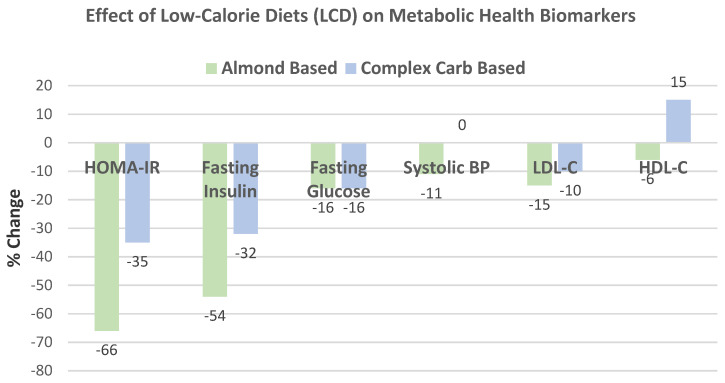
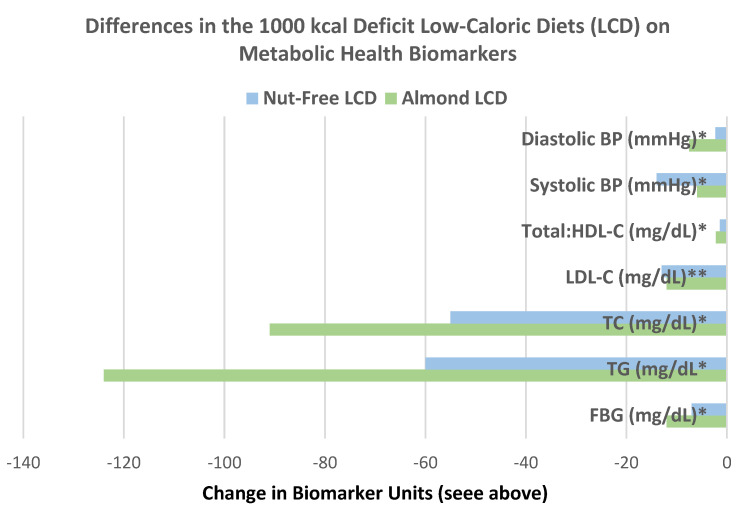
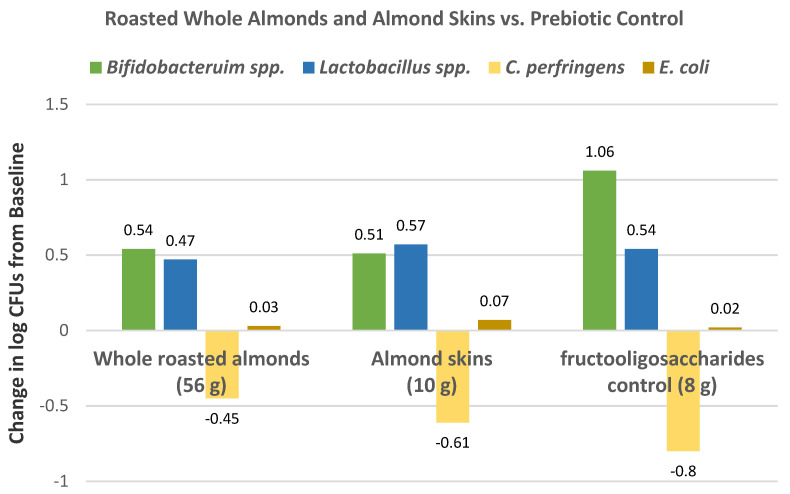
This comprehensive narrative review of 64 randomized controlled trials (RCTs) and 14 systematic reviews and/or meta-analyses provides an in-depth analysis of the effect of almonds on weight measures, metabolic health biomarkers and outcomes, and the colonic microbiota, with extensive use of figures and tables. Almonds are a higher energy-dense (ED) food that acts like a lower ED food when consumed. Recent systematic reviews and meta-analyses of nut RCTs showed that almonds were the only nut that had a small but significant decrease in both mean body mass and fat mass, compared to control diets. The biological mechanisms for almond weight control include enhanced displacement of other foods, decreased macronutrient bioavailability for a lower net metabolizable energy (ME), upregulation of acute signals for reduced hunger, and elevated satiety and increased resting energy expenditure. The intake of 42.5 g/day of almonds significantly lowered low-density lipoprotein cholesterol (LDL-C), 10-year Framingham estimated coronary heart disease (CHD) risk and associated cardiovascular disease (CVD) medical expenditures. Diastolic blood pressure (BP) was modestly but significantly lowered when almonds were consumed at >42.5 g/day or for >6 weeks. Recent RCTs suggest possible emerging health benefits for almonds such as enhanced cognitive performance, improved heart rate variability under mental stress, and reduced rate of facial skin aging from exposure to ultraviolet (UV) B radiation. Eight RCTs show that almonds can support colonic microbiota health by promoting microflora richness and diversity, increasing the ratio of symbiotic to pathogenic microflora, and concentrations of health-promoting colonic bioactives. Almonds are a premier healthy snack for precision nutrition diet plans.

Keywords: almonds; blood lipids; blood pressure (BP); body fat % (BF%); body mass; body mass index (BMI); body weight; central obesity; cognitive performance; colonic microbiota; coronary heart disease (CHD); endothelial health; energy density (ED); fat mass (FM); fat-free mass (FFM); glycemic control; hs-C-reactive protein (hs-CRP); insulin sensitivity; low-calorie diets (LCDs); nuts; pre-diabetes; precision nutrition; type 2 (T2) diabetes; waist circumference (WC).


Conflict of interest statement

M.L.D. is an ad hoc nutrition research consultant and was a voluntary member of the Almond Board of California’s Nutrition Research Committee from 2006 to 2018. There was no input from this Committee in the writing of this manuscript.

Figures

Figure 1
Figure 1
The effects of specific nut-enriched diets and overall nut intake on change in body mass compared to control diets based on a meta-analysis of 62 RCTs [24].
Figure 2
Figure 2
(A) Effect of nut-enriched diets compared to control diets on mean changes in body and fat mass (almonds body mass p = 0.007 and fat mass p ≤ 0.001; walnuts body mass p = 0.193 and body fat p = 0.476; pistachios body mass p = 0.141) [25,26,27]. (B) Effect of nut-enriched diets compared to control diets on mean changes in BMI (almonds p = 0.10, walnuts p = 0.164, and pistachios p < 0.001) and waist circumference (WC) (almonds p = 0.078, walnuts p = 0.651, and pistachios p = 0.087) [25,26,27].
Figure 3
Figure 3
Changes in body weight and composition measures after 60 g (344 kcals) raw almonds/day are added to the habitual diets of young women compared to the habitual diet control over 10 weeks (p > 0.05) [31].
Figure 4
Figure 4
Change in body weight measures from baseline to 8 weeks for baru almond-enriched diets and control diets in overweight/obese women (* p = 0.03) [35].
Figure 5
Figure 5
Effect of baru almonds and placebo on body components from baseline to 6 weeks (body mass (p = 0.07), BMI (p = 0.06), and body fat (%, p = 0.10) [36].
Figure 6
Figure 6
Effects of 5 servings per week of almonds or cheese sticks on body mass and composition parameters from baseline to 12 weeks in obese individuals with T2 diabetes (almonds BMI p = 0.047, body mass p = 0.083, and body fat p = 0.853) compared to cheese sticks [39].
Figure 7
Figure 7
Differences in ED between Atwater estimates and direct clinical measures of three forms of almonds when added to the typical American diet [6].
Figure 8
Figure 8
Dose–response effects of mid-morning raw almond snacking on subsequent meal energy intake, leading to an insignificant change in daily total energy intake compared to the water control in healthy women [7].
Figure 9
Figure 9
Effect of mid-morning snack on subjective ratings of hunger through dinner for almonds, savory crackers, and water control (almond vs. water p < 0.001 and almond vs. cracker p < 0.05) [40].
Figure 10
Figure 10
(A,B) Changes in body fat composition from baseline to 8 and 16 weeks for almond pre-meal snacking, between meal snacking and cookie snack control in young healthy adults [42].
Figure 11
Figure 11
Changes in body mass measures for almonds and control cookie snacking from baseline to 20 weeks [43].
Figure 12
Figure 12
Changes in body mass for almonds and control cookies over time (almonds p = 0.162 and cookies p = 0.001) [43].
Figure 13
Figure 13
Changes in WC for almonds and control cookies over time (almonds p for time effects = 0.013 [43].
Figure 14
Figure 14
Changes in % body mass and composition outcomes for raw almonds (42.5 g /day) compared to muffin control in identical heart-healthy diets from baseline to 6 weeks (* p < 0.02) [53].
Figure 15
Figure 15
Effect of 1000 kcal almond- and carbohydrate-based LCDs on weight measures from baseline to 24 weeks (** p < 0.0001 and * p < 0.05) [65].
Figure 16
Figure 16
Meta-analysis on mean changes in blood lipids between almond and control interventions (** p ≤ 0.001, * p = 0.042, + p = 0.207) [69].
Figure 17
Figure 17
Meta-analysis on mean differences in blood lipids between dose of almonds and control diets for ≥45 g doses of TC and LDL-C p = 0.001, and TG and HDL-C p ≤ 0.188, and <45 g doses of TG p = 0.199 and TC, LDL-C and HDL-C p ≥ 0.470 [69].
Figure 18
Figure 18
Dose–response effect of increasing level of almonds consumed with white bread on glycemic index over 120 min (* p < 0.02, ** p < 0.01) [74].
Figure 19
Figure 19
Effect of the average American diet and the average American diet with almonds on blood lipids in overweight and obese individuals from baseline to 4 weeks, with the inclusion of almonds lowering LDL-C by 4%, non-HDL-C by 5%, and LDL-C by 7% (* p <0.05) [77].
Figure 20
Figure 20
Changes in % mean CVD risk biomarkers for the almond diet compared to the muffin control diet from baseline to 6 weeks (* p = 0.037, ** p = 0.017, *** p < 0.00005) [45].
Figure 21
Figure 21
(A,B) Change in blood lipids from pre-meal almonds, almond snacks, and cookie snack control from baseline to 8 and 16 weeks [42].
Figure 21
Figure 21
(A,B) Change in blood lipids from pre-meal almonds, almond snacks, and cookie snack control from baseline to 8 and 16 weeks [42].
Figure 22
Figure 22
Effect of almond and cookie snacking on diastolic BP over time (almonds p-trend = 0.012 and control cookies p-trend = 0.135) [43].
Figure 23
Figure 23
Effects of 10 g of almonds soaked overnight in water and consumed before breakfast on atherogenic index compared to no almond control (p = 0.05) [37].
Figure 24
Figure 24
Change in cognitive measures after 6 months for almonds and mixed snacks with 84 g of almonds (3 servings/day) significantly improving working and visual memory cognitive measures (p < 0.017) compared to the control snack mix [81].
Figure 25
Figure 25
Almond group compared to carbohydrate-rich group on wrinkle measures (p < 0.02 for both almond wrinkle measures) from baseline to 16 weeks [82].
Figure 26
Figure 26
Dose–response effects on blood lipids when almonds are added to the NCEP Step 1 diet from baseline to 4 weeks: high almond intake significantly improved non-HDL-C lipids * (p < 0.001) and insignificantly changed HDL-C ** (p = 0.09) [50].
Figure 27
Figure 27
Regression analysis of correlation between almond intake and percentage decrease in the estimated 10-year Framingham coronary heart disease (CHD) risk score in hyperlipidemic adults [85].
Figure 28
Figure 28
Effect of heart-healthy diets with raw almonds or a muffin control in hyperlipidemic individuals from baseline to 6 weeks, * p = 0.04, ** p = 0.02, and *** p < 0.01 [53].
Figure 29
Figure 29
Dose–response effects of almond-enriched NCEP Step 2 diets from baseline to 4 weeks: (1) full-dose almonds significantly reduced TC, LDL-C, and Apo-B (p < 0.001), (2) half-dose almonds reduced TC, LDL-C, and Apo-B (p < 0.057), (3) both almond doses significantly increased HDL-C (p < 0.047), and (4) the muffin control only significantly increased triglycerides (p = 0.031), with no significant changes in non-HDL or HDL-C blood lipids [51].
Figure 30
Figure 30
Dose–response effects of almond NCEP Step 2 diets from baseline to 4 weeks: (1) Both doses of almonds significantly reduced LDL oxidation compared to baseline and muffin control (p < 0.001). (2) The full almond dose significantly reduced estimated 10-year CHD risk (p ≤ 0.029) [51].
Figure 31
Figure 31
Effect of almond National Cholesterol Education Program (NCEP) Step 1 diets on vascular function factors and tocopherols relative to control NCEP Step 1 diet from baseline to 6 weeks [86].
Figure 32
Figure 32
Postprandial % change in area under the curve (AUC) for blood glucose and insulin responses for isocaloric white bread plus almonds vs. white bread plus butter and cheddar cheese meals (* p = 0.283, ** p = 0.021, **** p ≤ 0.005) [90].
Figure 33
Figure 33
The almond snack significantly lowered hs-CRP (p = 0.029) and other inflammatory markers (p > 0.05) vs. the control diets from baseline to 6 weeks (p > 0.05) [34].
Figure 34
Figure 34
Effect of consuming an almond-supplemented NCEP Step 2 diet relative to a control in T2 diabetic subjects from baseline to 4 weeks [54].
Figure 35
Figure 35
Change (%) in metabolic risk biomarkers between the almond diet and nut-free control diet for baseline to 16 weeks during a weight maintenance diet in prediabetic individuals [62].
Figure 36
Figure 36
Comparison of HbA1c and the depression scores between almond low-carbohydrate and low-fat diets between baseline and 12 weeks (for almonds, p < 0.01 for both) [59].
Figure 37
Figure 37
Summary of effects of almond-enriched and complex carb-based LCDs on metabolic outcomes from baseline to 24 weeks: almond vs. complex carb LCD change in HOMA-IR, fasting insulin and glucose, and LDL-C (p < 0.0001), systolic BP (p < 0.01), and HDL-C (p < 0.05) [65].
Figure 38
Figure 38
Difference in metabolic healthy biomarkers between almond and nut-free LCDs from baseline to 12 weeks (fasting blood glucose (FBG), triglycerides (TG), total cholesterol (TC), low-density lipoprotein cholesterol (LDL-C), and blood pressure (BP), *p ≤ 0.001 and ** p = 0.002) [66].
Figure 39
Figure 39
Change in colony-forming units (CFUs) from baseline to 6 weeks: (1) symbiotic bacteria Bifidobacterium and Lactobacillus increased (p ≤ 0.05 for all) and (2) pathogenic bacteria Clostridium perfringens decreased for fructooligosaccharides and almond skins (p < 0.05) and whole almonds (p < 0.1), and there were no significant changes in fecal E. coli (p > 0.05) [97].

References

    1. U.S. Department of Agriculture, Agricultural Research Service Food Data Central, Almond Legacy. [(accessed on 18 November 2020)];2019 Available online: fdc.nal.usda.gov.
    1. Barreca D., Nabavi S.M., Sureda A., Basekhian M., Raciti R., Silva A.S., Annunziata G., Arnone A., Tenore G.C., Suntar I., et al. Almonds (prunus dulcis mill. D.A. Webb): A source of nutrients and health-promoting compounds. Nutrients. 2020;12:672. doi: 10.3390/nu12030672. - DOI - PMC - PubMed
    1. Dikariyanto V., Berry S.E., Francis L., Smith L., Hall W.L. Whole almond consumption is associated with better diet quality and cardiovascular disease risk factors in the UK adult population: National Diet and Nutrition Survey (NDNS) 2008–2017. Eur. J Nutr. 2020;60:643–654. doi: 10.1007/s00394-020-02270-9. - DOI - PMC - PubMed
    1. Mattes R.D., Dreher M.L. Nuts and healthy body weight maintenance mechanisms. Asia Pac. J. Clin. Nutr. 2010;19:137–141. - PubMed
    1. Novotny J.A., Gebauer S.K., Baer D.J. Discrepancy between the Atwater factor prediction and empirically measured energy values of almonds in human diets. Am. J. Clin. Nutr. 2012;96:296–301. doi: 10.3945/ajcn.112.035782. - DOI - PMC - PubMed