

National Trends in Cycling in Light of the Norwegian Bike Traffic Index
- PMID: 34201144
- PMCID: PMC8228709
- DOI: 10.3390/ijerph18126198
National Trends in Cycling in Light of the Norwegian Bike Traffic Index
Abstract
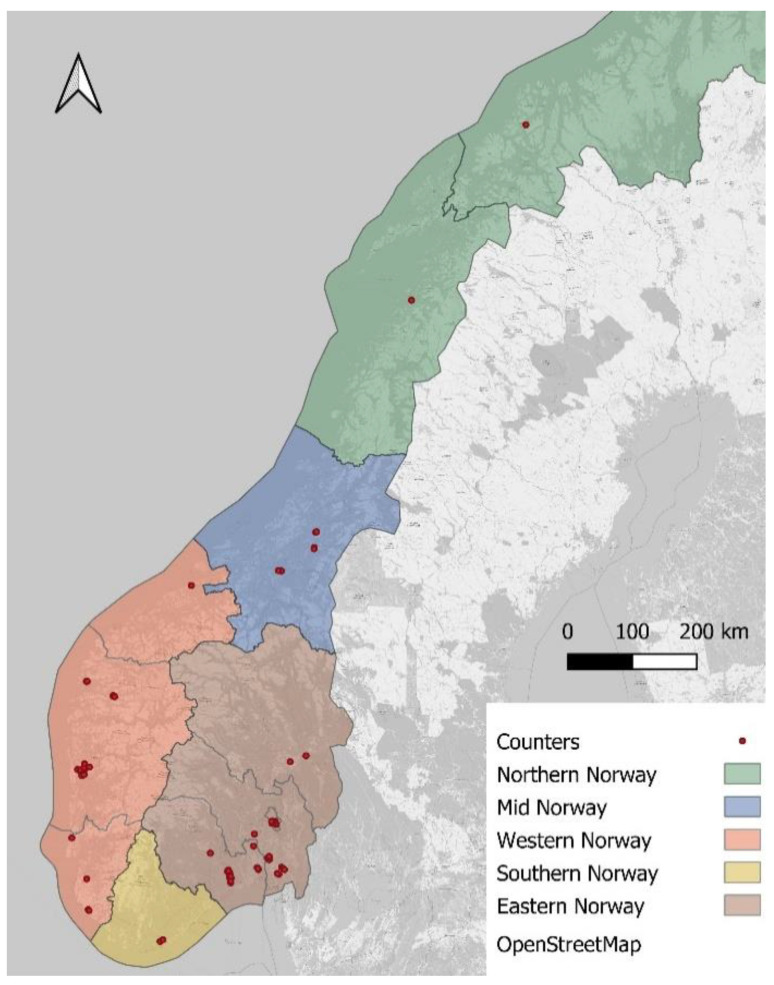
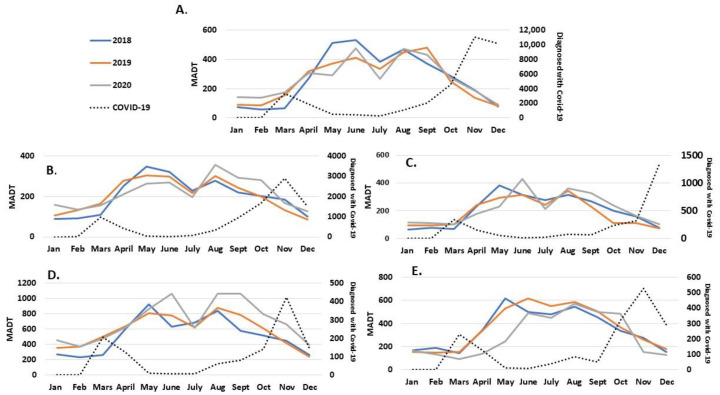
National and international strategies and recommendations are intended to increase physical activity in the general population. Active transportation is included in interdisciplinary strategies to meet these recommendations. Cycling seems to be more health enhancing than walking for transportation since cycling seems to reduce the risk of cardiovascular disease and associated risk factors. Furthermore, the health benefits of cycling are proven to outrun the risk of injuries and mortality. Politicians seem to approve costly infrastructure strategies to increase the amount of cycling in the population to improve public health and shift to more sustainable travel habits. A linear relationship between cycle-friendly infrastructure and the amount of commuter cycling has been demonstrated. However, in Norway and on a global level, there is a lack of robust evaluations of actions and sensitive monitoring systems to observe possible change. Therefore, we aimed to develop the Norwegian bike traffic index and describe the national, regional, and local trends in counted cycle trips. We used a transparent methodology so that the index can be used, developed, and adapted in other countries. We included 89 stationary counters from the whole country. Counters monitored cycling from 2018 onward. The index is organized at local, regional, and national levels. Furthermore, the index is adjusted for population density at the counter level and presented as ratio of counted cycle trips, comparing 2018 to subsequent years. The index is presented as a percentage change with 95% confidence intervals. In Norway, counted cycle trips increased by 11% from 2018 (100, 100-100) to 2020 (111.0, 106.2-115.1), with large geographical differences. In Southern Norway, there was a significant increase of 23%, and in Northern Norway, there was a nonsignificant decrease by 8% from 2018 to 2020. The indices may indicate possible related effects of local to national cycling strategies and how the COVID-19 pandemic has affected Norwegian travel habits in urban areas.
Keywords: active travel; bicycle transport; employee commuting; monitoring bicycle employee ride; the Norwegian bike traffic index.
Conflict of interest statement
The authors declare no conflict of interest.
Figures

Similar articles
-
Provisional COVID-19 infrastructure induces large, rapid increases in cycling.Proc Natl Acad Sci U S A. 2021 Apr 13;118(15):e2024399118. doi: 10.1073/pnas.2024399118. Proc Natl Acad Sci U S A. 2021. PMID: 33782111 Free PMC article.
-
From cars to bikes - the feasibility and effect of using e-bikes, longtail bikes and traditional bikes for transportation among parents of children attending kindergarten: design of a randomized cross-over trial.BMC Public Health. 2017 Dec 28;17(1):981. doi: 10.1186/s12889-017-4995-z. BMC Public Health. 2017. PMID: 29282108 Free PMC article. Clinical Trial.
-
Correlates of Commuter Cycling in Three Norwegian Counties.Int J Environ Res Public Health. 2019 Nov 8;16(22):4372. doi: 10.3390/ijerph16224372. Int J Environ Res Public Health. 2019. PMID: 31717447 Free PMC article.
-
Policies to Promote Active Travel: Evidence from Reviews of the Literature.Curr Environ Health Rep. 2017 Sep;4(3):278-285. doi: 10.1007/s40572-017-0148-x. Curr Environ Health Rep. 2017. PMID: 28695486 Review.
-
Protective Effect on Mortality of Active Commuting to Work: A Systematic Review and Meta-analysis.Sports Med. 2020 Dec;50(12):2237-2250. doi: 10.1007/s40279-020-01354-0. Sports Med. 2020. PMID: 33034873
Cited by
-
Predictors of Mortality in Bicycle-Related Trauma: An Eight-Year Experience in a Level One Trauma Center.J Pers Med. 2022 Nov 21;12(11):1936. doi: 10.3390/jpm12111936. J Pers Med. 2022. PMID: 36422112 Free PMC article.
References
-
- Høie B. Sammen om Aktive liv. Handlingsplan for Fyisk Aktivitet 2020–2029. Ministry of Health and Care Services; Oslo, Norway: 2020. [(accessed on 7 June 2021)]. Available online: https://www.regjeringen.no/contentassets/43934b653c924ed7816fa16cd1e8e52....
-
- Larsen B.-I. Global Strategi for Kosthold, Fysisk Aktivitet og Helse. Ministry of Health and Care Services; Oslo, Norway: 2004. IS-1213.
-
- Rasmussen M.G., Grøntved A., Blond K., Overvad K., Tjønneland A., Jensen M.K., Østergaard L. Associations between recreational and commuter cycling, changes in cycling, and type 2 diabetes risk: A cohort study of Danish men and women. PLoS Med. 2016;13:e1002076. doi: 10.1371/journal.pmed.1002076. - DOI - PMC - PubMed
-
- Patterson R., Panter J., Vamos E.P., Cummins S., Millett C., Laverty A.A. Associations between commute mode and cardiovascular disease, cancer, and all-cause mortality, and cancer incidence, using linked Census data over 25 years in England and Wales: A cohort study. Lancet Planet. Health. 2020;4:e186–e194. doi: 10.1016/S2542-5196(20)30079-6. - DOI - PMC - PubMed
-
- Celis-Morales C.A., Lyall D.M., Welsh P., Anderson J., Steell L., Guo Y., Maldonado R., Mackay D.F., Pell J.P., Sattar N. Association between active commuting and incident cardiovascular disease, cancer, and mortality: Prospective cohort study. BMJ. 2017;357:j1456. doi: 10.1136/bmj.j1456. - DOI - PubMed
MeSH terms
LinkOut - more resources
Full Text Sources
Medical
