. 2021 Jun 8;7(6):463.
doi: 10.3390/jof7060463.

MoGLN2 Is Important for Vegetative Growth, Conidiogenesis, Maintenance of Cell Wall Integrity and Pathogenesis of Magnaporthe oryzae

Affiliations

MoGLN2 Is Important for Vegetative Growth, Conidiogenesis, Maintenance of Cell Wall Integrity and Pathogenesis of Magnaporthe oryzae

Osakina Aron et al. J Fungi (Basel). .

Abstract

Glutamine is a non-essential amino acid that acts as a principal source of nitrogen and nucleic acid biosynthesis in living organisms. In Saccharomyces cerevisiae, glutamine synthetase catalyzes the synthesis of glutamine. To determine the role of glutamine synthetase in the development and pathogenicity of plant fungal pathogens, we used S. cerevisiae Gln1 amino acid sequence to identify its orthologs in Magnaporthe oryzae and named them MoGln1, MoGln2, and MoGln3. Deletion of MoGLN1 and MoGLN3 showed that they are not involved in the development and pathogenesis of M. oryzae. Conversely, ΔMogln2 was reduced in vegetative growth, experienced attenuated growth on Minimal Medium (MM), and exhibited hyphal autolysis on oatmeal and straw decoction and corn media. Exogenous l-glutamine rescued the growth of ΔMogln2 on MM. The ΔMogln2 mutant failed to produce spores and was nonpathogenic on barley leaves, as it was unable to form an appressorium-like structure from its hyphal tips. Furthermore, deletion of MoGLN2 altered the fungal cell wall integrity, with the ΔMogln2 mutant being hypersensitive to H2O2. MoGln1, MoGln2, and MoGln3 are located in the cytoplasm. Taken together, our results shows that MoGLN2 is important for vegetative growth, conidiation, appressorium formation, maintenance of cell wall integrity, oxidative stress tolerance and pathogenesis of M. oryzae.

Keywords: Magnaporthe oryzae; cell wall integrity; glutamine; glutamine synthetase; pathogenicity.


Conflict of interest statement

The authors declare no conflict of interest.

Figures

Figure 1
Figure 1
Domain architecture and phylogeny of M. oryzae glutamine synthetase in different fungi: (A) Gln1 domain architecture and maximum likelihood based phylogenetic outlook in different fungi; (B) Gln2 domain architecture and maximum likelihood phylogenetic analysis in fungi groups; (C) Domain architecture of Gln3 and the maximum likelihood phylogeny in different fungi. Maximum likelihood phylogeny for the glutamine synthetase amino acids of different fungi was tested with 1000 bootstrap replicates.
Figure 2
Figure 2
Phase-specific expression of the three MoGLN genes at various development stages of M. oryzae. (A) phase-specific expression of MoGLN1; (B) phase-specific expression of MoGLN2; (C) phase-specific expression of MoGLN3. The phase-specific expression of the three MoGLN genes was quantified by quantitative real-time (QRT)-PCR after synthesis of cDNA in each developmental stage. The ACTIN gene (MGG_03982) was used for internal control for normalization, and the expression level of each gene at the mycelial stage was considered 1 for further comparisons. The qPCR results were obtained from three independent biological replications with three technical replicates. Error bars represent standard deviations. Asterisks indicate statistically significant differences (**, p < 0.01; ***, p < 0.001; one-way ANOVA was used to analyze data with Tukey’s multiple-comparison test in GraphPad Prism 8).
Figure 3
Figure 3
Southern blot analysis to confirm MoGLN deletion mutants. (A,B) Sketch representation of deletion of MoGLN1 in the M. oryzae genome and southern blot analysis of the gene knockout mutants and WT Guy11 via MoGLN1 ORF probe A and hygromycin phosphotransferase (HPH) probe B. (C,D) Sketch representation of deletion of MoGLN2 in M. oryzae genome and southern blot analysis of the gene knockout mutant and WT Guy11 via MoGLN2 ORF probe A and hygromycin phosphotransferase (HPH) probe B. (E,F) Sketch representation of deletion of MoGLN3 in the M. oryzae genome and southern blot analysis of the gene knockout mutant and the WT Guy11 using MoGLN3 ORF probe A and hygromycin phosphotransferase (HPH) probe B.
Figure 4
Figure 4
MoGLN2 is required for vegetative growth in M. oryzae. (A) Photographs showing radial and aerial hyphal growth of the wild-type (WT) and the three mutants. Mycelial plugs inoculated on CM, MM, OTM, and SDC were cultured in the dark at 28 °C, and photograph taken after eight days. (B) Bar graphs showing the difference in radial growth between the WT and the three MoGLN mutants. The error bar represents the standard deviation of three independent replicates, while the double asterisk shows significant difference (**, p < 0.01; ***, p < 0.001; one-way ANOVA was used to analyze data with Tukey’s multiple-comparison test in GraphPad Prism 8).
Figure 5
Figure 5
Exogenous glutamine restores growth defects of ΔMogln2 on MM medium. (A) Radial growth of ΔMogln2 mutant on MM medium supplemented with different concentrations of glutamine. The experiment was repeated three times with similar results obtained. (B) Statistical representation of intracellular glutamine levels detected in WT and the three MoGLN mutants. Error bars represent standard deviations obtained from two independent tests. Data were analyzed using GraphPad Prism 8; asterisks indicate statistically significant differences (**, p < 0.01; ***, p < 0.001; based on one-way ANOVA with Tukey’s multiple-comparison test). (C) Graph showing the expression of MoGLN2 and MoGLN3 in ΔMogln1 mutant; (D) graphical representation of expression pattern of MoGLN1 and MoGLN3 in the ΔMogln2 mutant; (E) expression pattern of MoGLN1 and MoGLN2 in ΔMogln3 mutant. The actin gene was used as a control. Data for statistical analysis were obtained after performing three independent biological replicates. Error bars represent standard deviations. Asterisks indicate statistically significant differences (**, p < 0.01; ***, p < 0.001; one-way ANOVA was used to analyze data with Tukey’s multiple-comparison test in GraphPadPrism 8).
Figure 6
Figure 6
MoGln2 plays an important role in asexual reproduction in M. oryzae. (A) Represents conidiophore development and spore formation capacity of strains cultured on rice bran medium for 10 days. Bar, 10 μm. (B) Graph showing quantification of spores from Guy11, ΔMogln1, ΔMogln2, ΔMogln3 strains on rice bran medium. The ΔMogln2 mutant failed to produce spores. (C) Quantitative RT-PCR analysis showing the expression of conidiation-related genes in the WT and ΔMogln2 mutants. The expression was normalized actin gene (MGG_03982). Results are means obtained from three independent replicates. Error bars represents standard deviations. Asterisks indicate statistically significant differences (**, p < 0.01; ***, p < 0.001; one-way ANOVA was applied to analyze data with Tukey’s multiple-comparison test in GraphPad Prism 8).
Figure 7
Figure 7
MoGln2 plays a crucial role in appressorium formation in rice blast fungus. (A) Bright field micrographs of the appressoria formed by WT, ΔMogln1, and ΔMogln3 mutants on inductive hydrophobic cover slips. Conidia from WT, ΔMogln1, and ΔMogln3 mutants were inoculated on a hydrophobic cover slip, and appressoria formation was observed at 4 h, 8 h, 12 h, and 24 h time intervals. Scale bar = 10 μm. (B) An appressorium-like structure formed on a hydrophobic surface and barley leaves. Mycelia plugs derived from WT, ΔMogln1, ΔMogln2, and ΔMogln3 were inoculated on 10-day-old barley leaves, and inductive hydrophobic cover slips; appressorium-like structure formation was observed after 30 h. Scale bar = 10 μm. The ΔMogln2 mutant failed to form appressorium-like structures both on barley leaves and hydrophobic cover slips.
Figure 8
Figure 8
MoGLN2 plays an important role in promoting the infections of M. oryzae. (A,B) ΔMogln2 failed to induce hyphae-mediated blast lesions on intact and injured barley leaves. (C) Rice leaves bearing blast lesions of ΔMogln1 and ΔMogln3 mutant spores. Both barley and rice leaf images were taken seven days post inoculation.
Figure 9
Figure 9
Bright field micrographs showing the development of invasive hyphal growth of WT, ΔMogln1, and ΔMogln3. Spore suspensions from Guy11, ΔMogln1, and ΔMogln3 strains were inoculated on 10-day-old barley leaves, and invasive hyphal growth was observed at 30 h, 48 h, and 72 h. Bar= 20 µm.
Figure 10
Figure 10
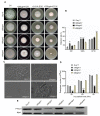
MoGLN2 is essential for maintenance of cell wall integrity in M. oryzae. (A) The Guy11 and MoGLN mutants were cultured on CM medium supplemented with (200 µg/mL CR, 0.01% SDS, and 200 µg/mL CFW) at 28 °C for 8 days before being photographed. (B) Graph showing inhibition rate of WT and mutant strains. Inhibition rate was compared to the growth rate of each untreated control (Inhibition rate = (the diameter of untreated strain − the diameter of treated strain)/(the diameter of untreated strain × 100%)). Three independent repeats were performed, with similar results obtained. (C) Light microscopic examination of protoplast release after treatment with cell-wall-degrading enzymes for 30 min, 60 min, and 90 min at 28 °C. Bar= 10 µm (D) Graphical representation of protoplast release assay for the WT and three MoGLN mutants. (E) Phosphorylation of MoMps1 in WT and three MoGLN mutants, ΔMops1, and ΔMopmk1. Proteins were prepared from mycelia inoculated in liquid CM, and the phosphorylated MoMps1 was detected by binding of the antiphospho-p44/42 antibody, with the Mpk1 antibody as a control. The phosphorylation level of MoMps1 in the ΔMogln2 strains indicated the reduced activation of MoMps1. Statistical results for growth inhibition rate and protoplast results were obtained from at least three independent replicates. Error bars represent standard deviations. Asterisks indicate statistically significant differences (*, p < 0.005 **, p < 0.01, ***, p < 0.001; one-way ANOVA was used to analyze data with Tukey’s multiple-comparison test in GraphPad Prism 8).
Figure 11
Figure 11
Sensitivity of the three MoGLN mutants to H2O2. (A) Growth phenotype of the WT and MoGLN mutants under oxidative stress. The WT and three mutant strains were inoculated on CM agar medium with or without 2.5 mM H2O2 and 5 mM H2O2 and cultured at 28 °C for 10 days. (B) The colony diameters of the strain tested were measured, and statistical analysis was performed. The growth inhibition rate was compared to the growth rate of each untreated control (Inhibition rate = (the diameter of untreated strain − the diameter of treated strain)/(the diameter of untreated strain × 100%)). Three independent repeats were performed, with similar results obtained. Error bars denote the standard deviations from means obtained from three independent replicates. Asterisks indicate statistically significant differences (**, p < 0.01; ***, p < 0.001; one-way ANOVA was used to analyze data with Turkey’s multiple-comparison test in Graph Pad Prism 8).
Figure 12
Figure 12
MoGLN2 is required for hyphal melanization in M. oryzae. (A) Mycelial growth in liquid CM medium showing impaired hyphal melanization as a result of MoGLN2 gene. (B) qRT-PCR analysis of the expression levels of genes important for melanin biosynthesis in mycelium grown in liquid CM. Error bars denote the standard deviations from means obtained from three independent replicates. Asterisks indicate statistically significant differences (*, p < 0.005; ***, p < 0.001; one-way ANOVA was used to analyze data with Tukey’s multiple-comparison test in GraphPad Prism 8).
Figure 13
Figure 13
Molecular functions of the genes up-regulated (A) and down regulated (B) in ΔMogln2 at a two-fold expression threshold based on the Gene Ontology (GO) terms.
Figure 14
Figure 14
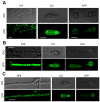
Subcellular localization of MoGln1, MoGln2, and MoGln3 in rice blast fungus. (AC) The localization pattern of MoGln1-GFP, MoGln2-GFP, and MoGln3-GFP in hyphae, conidia, and appressorium. Localization of MoGln1-GFP, MoGln2-GFP, and MoGln3-GFP were examined by Nikon laser confocal, scale bar = 10 μm, MoGln1-GFP hyphae scale bar = 5 μm.

Similar articles

Cited by

References

    1. Cooper A.J., Jeitner T.M. Central role of glutamate metabolism in the maintenance of nitrogen homeostasis in normal and hyperammonemic brain. Biomolecules. 2016;6:16. doi: 10.3390/biom6020016. - DOI - PMC - PubMed
    1. Curi R., Lagranha C.J., Doi S.Q., Sellitti D., Procópio J., Pithon-Curi T.C., Corless M., Newsholme P. Molecular mechanisms of glutamine action. J. Cell. Physiol. 2005;204:392–401. doi: 10.1002/jcp.20339. - DOI - PubMed
    1. Albrecht J., Sidoryk-Wegrzynowicz M., Zielinska M., Aschner M. Roles of glutamine in neurotransmission. Neuron Glia Biol. 2010;6:263. doi: 10.1017/S1740925X11000093. - DOI - PubMed
    1. Carr E.L., Kelman A., Wu G.S., Gopaul R., Senkevitch E., Aghvanyan A., Turay A.M., Frauwirth K.A. Glutamine uptake and metabolism are coordinately regulated by ERK/MAPK during T lymphocyte activation. J. Immunol. 2010;185:1037–1044. doi: 10.4049/jimmunol.0903586. - DOI - PMC - PubMed
    1. Haeussinger D., Schliess F. Glutamine metabolism and signaling in the liver. Front. Biosci. 2007;12:371–391. doi: 10.2741/2070. - DOI - PubMed

LinkOut - more resources