. 2021 Jun 23;10(7):1580.
doi: 10.3390/cells10071580.

Dual Mode of Action of Acetylcholine on Cytosolic Calcium Oscillations in Pancreatic Beta and Acinar Cells In Situ

Affiliations

Dual Mode of Action of Acetylcholine on Cytosolic Calcium Oscillations in Pancreatic Beta and Acinar Cells In Situ

Nastja Sluga et al. Cells. .

Abstract

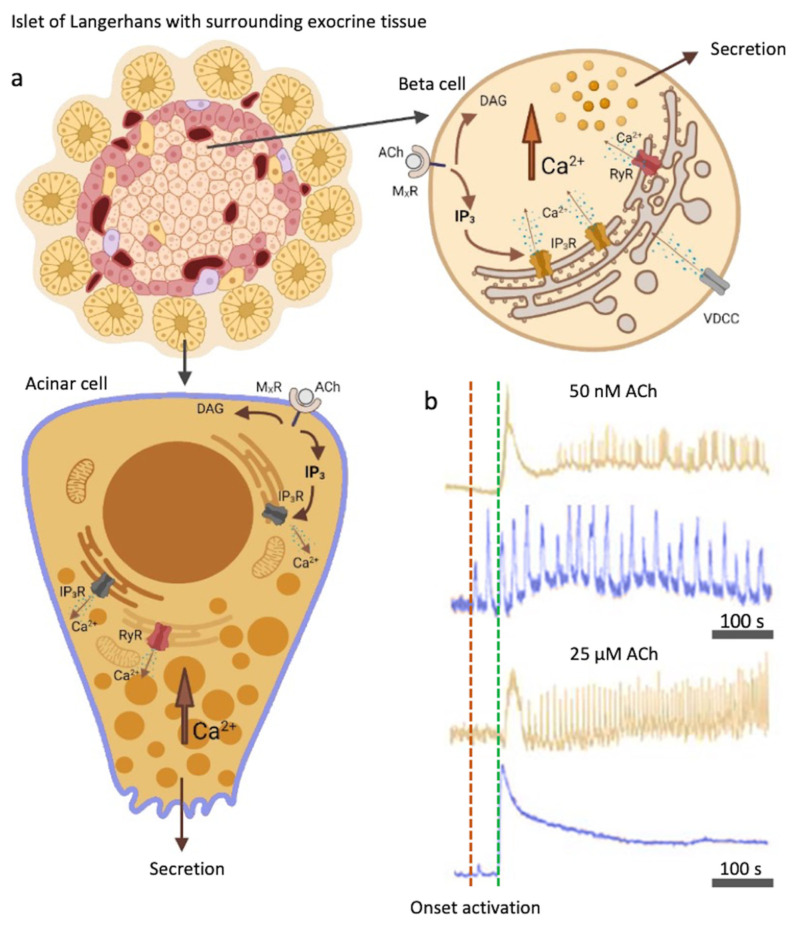
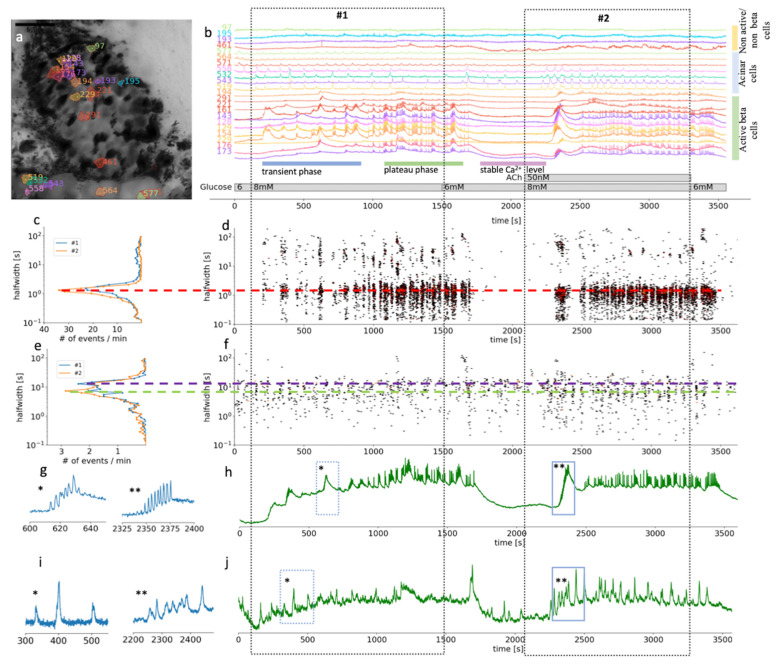
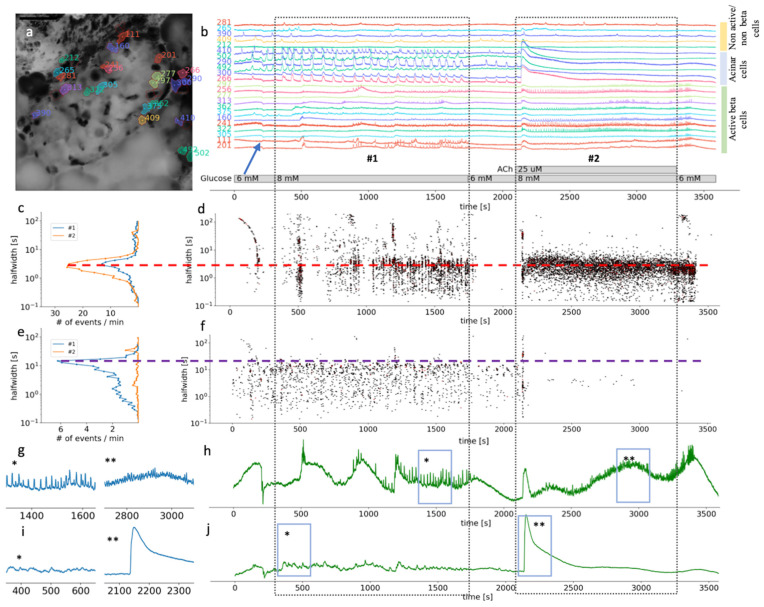
Cholinergic innervation in the pancreas controls both the release of digestive enzymes to support the intestinal digestion and absorption, as well as insulin release to promote nutrient use in the cells of the body. The effects of muscarinic receptor stimulation are described in detail for endocrine beta cells and exocrine acinar cells separately. Here we describe morphological and functional criteria to separate these two cell types in situ in tissue slices and simultaneously measure their response to ACh stimulation on cytosolic Ca2+ oscillations [Ca2+]c in stimulatory glucose conditions. Our results show that both cell types respond to glucose directly in the concentration range compatible with the glucose transporters they express. The physiological ACh concentration increases the frequency of glucose stimulated [Ca2+]c oscillations in both cell types and synchronizes [Ca2+]c oscillations in acinar cells. The supraphysiological ACh concentration further increases the oscillation frequency on the level of individual beta cells, inhibits the synchronization between these cells, and abolishes oscillatory activity in acinar cells. We discuss possible mechanisms leading to the observed phenomena.

Keywords: Ca2+ oscillations; acetylcholine; acinar cell; beta cell; pancreas tissue slices.


Conflict of interest statement

The authors declare no conflict of interest. The funders had no role in the design of the study; in the collection, analyses, or interpretation of data; in the writing of the manuscript, or in the decision to publish the results.

Figures

Figure 1
Figure 1
Muscarinic activation with ACh and the IP3 signaling pathway in beta cells and acinar cells. (a) Acinar and beta cells express muscarinic receptors (MXRs), activation of which results in IP3 and DAG production. IP3 specifically binds to IP3R on the ER and triggers Ca2+ mobilization, leading to an oscillatory rise in [Ca2+]c. Additionally, RYR receptors can be activated. L-type VDCCs play a role in Ca2+ refilling of the ER. (b) Color-coded time courses for beta (light brown) and acinar cells (blue) simultaneously stimulated with 8 mM glucose in combination with a physiological (50 nM, top traces) or a supraphysiological (25 µM, bottom traces) ACh concentration. The activation onsets after the cells were stimulated for the acinar cells (red) and the beta cells (green) are indicated with the vertical dashed lines. Legend: MxR = muscarinic receptor, ACh = acetylcholine, DAG = diacylglycerol, IP3 = 1,4,5-inositol trisphosphate, IP3R = inositol (1,4,5) trisphosphate receptor, RYR = ryanodine receptors. Created with [40].
Figure 2
Figure 2
Time scales and heterogeneity of responses of cytosolic Ca2+ oscillations in mouse beta and acinar cells stimulated with 8 mM glucose or 8 mM glucose plus 50 nM ACh. (a) Localization of several beta, acinar and non-active beta on non-beta cells in a pancreas tissue slice. (b) Time course of the [Ca2+]c changes in beta, acinar and non-active beta on non-beta cells selected in (a). The two dashed rectangles stretching across the panels indicate the periods of stimulation. (c) Frequency histogram of the halfwidth durations of the events and (d), onset time of the [Ca2+]c events at measured time scales for beta cells (n = 82). Addition of 50 nM ACh increased the frequency of the [Ca2+]c events, the dominant halfwidth duration stayed unchanged (red dashed line). (e) Frequency histogram of the halfwidth durations of the events and (f), onset time of the [Ca2+]c events at measured time scales for functional region of acinar cells (n = 48). Addition of 50 nM ACh increased the frequency of the [Ca2+]c events, the dominant halfwidth length shortened (blue and green dashed line). (g) Expanded time traces of an individual ROI (*) from a representative beta cells or an average of all ROIs (**) of active beta cells (n = 82) as indicated by small blue rectangles in (h). (i) Expanded time traces of an individual ROI (*) from a representative acinar ROI or an average of all functional regions of acinar cells ROIs (**) (c = 48) as indicated on the temporal profile in (j) with small blue rectangles.
Figure 3
Figure 3
Time scales and heterogeneity of responses of cytosolic Ca2+ oscillations in mouse beta and acinar cells stimulated with 8 mM glucose or 8 mM glucose plus 25 µM ACh. (a) Localization of several beta, acinar and non-active beta on non-beta cell in pancreas tissue slices. (b) Temporal profile of the [Ca2+]c changes in a beta, acinar and non-active beta on non-beta cells shown in pancreas tissue slice in (a). The two dashed rectangles stretching across the panes indicate the periods of stimulation. (c) The frequency histogram of the halfwidth durations of the events and (d), onset time of the [Ca2+]c events at measured time scales for active beta cells (n = 113). Addition of 25 μM ACh increased the frequency of the [Ca2+]c events, the dominant halfwidth duration stayed unchanged (red dashed line). (e) The frequency histogram of the halfwidth durations of the events in acinar cell and (f), onset time of the [Ca2+]c events at measured time scales for functional regions of acinar cells (n = 33). Addition of 25 μM ACh abolished [Ca2+]c oscillations of the dominant scale (violet dashed line). (g) Expanded time traces of an average from all ROIs specify as active beta cell shown in (h) (n = 113). (h) (*) is indicating plateau phase of the response to glucose stimulatory concentration. (**) is indicating fast events in plateau phase during stimulation with 25 µM on top of the 8 mM glucose in panel. (i) Expanded time traces of an average from all ROIs correspond to functional regions of acinar cells (n = 33), shown in (j). (*) is indicating average [Ca2+]c events during stimulation with 8 mM glucose. (**) is indicating average [Ca2+]c events during stimulation with 25 µM ACh on top of the stimulatory glucose concentration. Blue arrow on (b) is indicating an artefact due to a transient slice movement that occurred during imaging and was detectable in multiple time traces.

Similar articles

Cited by

References

    1. Ahrén B. Autonomic regulation of islet hormone secretion–Implications for health and disease. Diabetologia. 2000;43:393–410. doi: 10.1007/s001250051322. - DOI - PubMed
    1. Gilon P., Henquin J.-C. Mechanisms and Physiological Significance of the Cholinergic Control of Pancreatic β-Cell Function. Endocr. Rev. 2001;22:565–604. - PubMed
    1. Brunicardi F.C., Shavelle D.M., Andersen D.K. Neural Regulation of the Endocrine Pancreas. Int. J. Pancreatol. 1995;18:177–195. - PubMed
    1. Ahrén B., Taborsky G.J., Porte D. Neuropeptidergic versus cholinergic and adrenergic regulation of islet hormone secretion. Diabetologia. 1986;29:827–836. doi: 10.1007/BF00870137. - DOI - PubMed
    1. Taylor C.W. Inositol trisphosphate receptors Ca2+-modulated intracellular Ca2+ channels. Biochim. Et Biophys. Acta BBA Mol. Cell Biol. Lipids. 1998;1436:19–33. doi: 10.1016/S0005-2760(98)00122-2. - DOI - PubMed

Publication types

LinkOut - more resources