. 2021 Jun 23;22(13):6710.
doi: 10.3390/ijms22136710.

Assessment of Biotechnologically Important Filamentous Fungal Biomass by Fourier Transform Raman Spectroscopy

Affiliations

Assessment of Biotechnologically Important Filamentous Fungal Biomass by Fourier Transform Raman Spectroscopy

Simona Dzurendová et al. Int J Mol Sci. .

Abstract

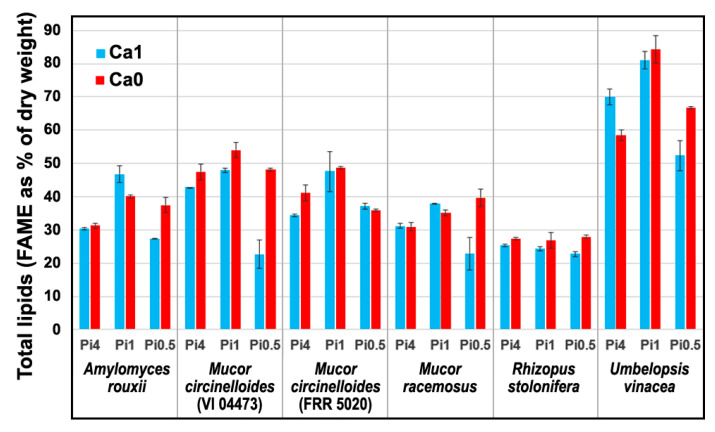
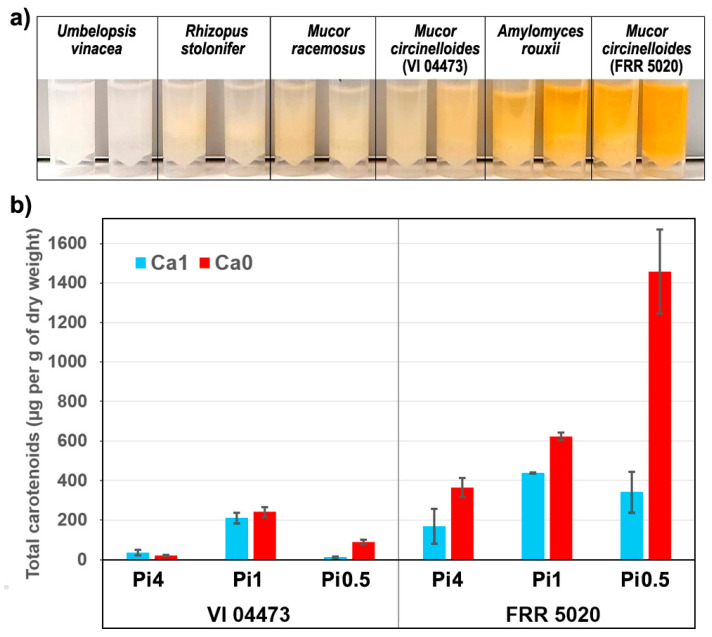
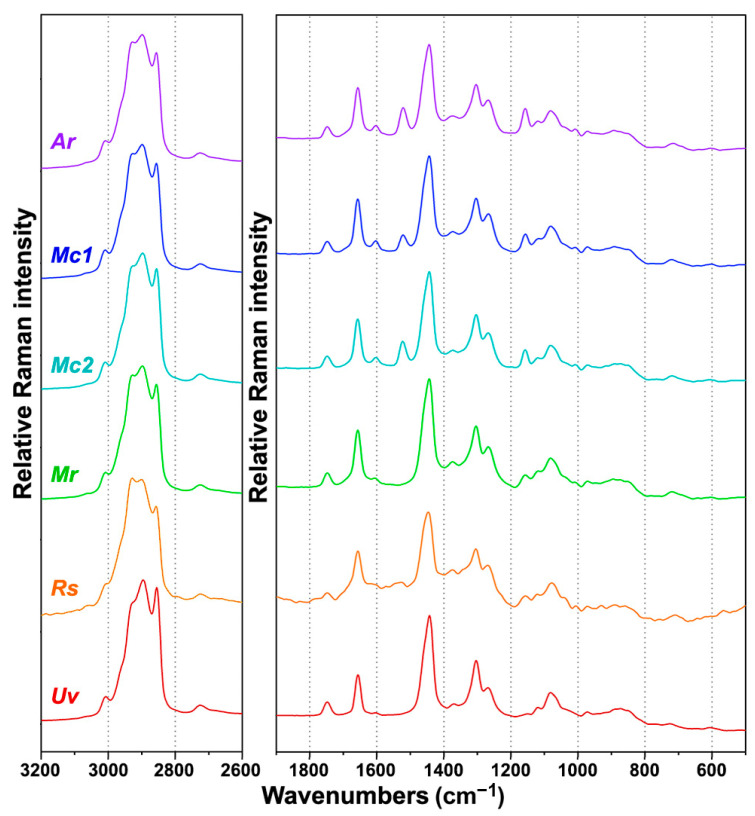
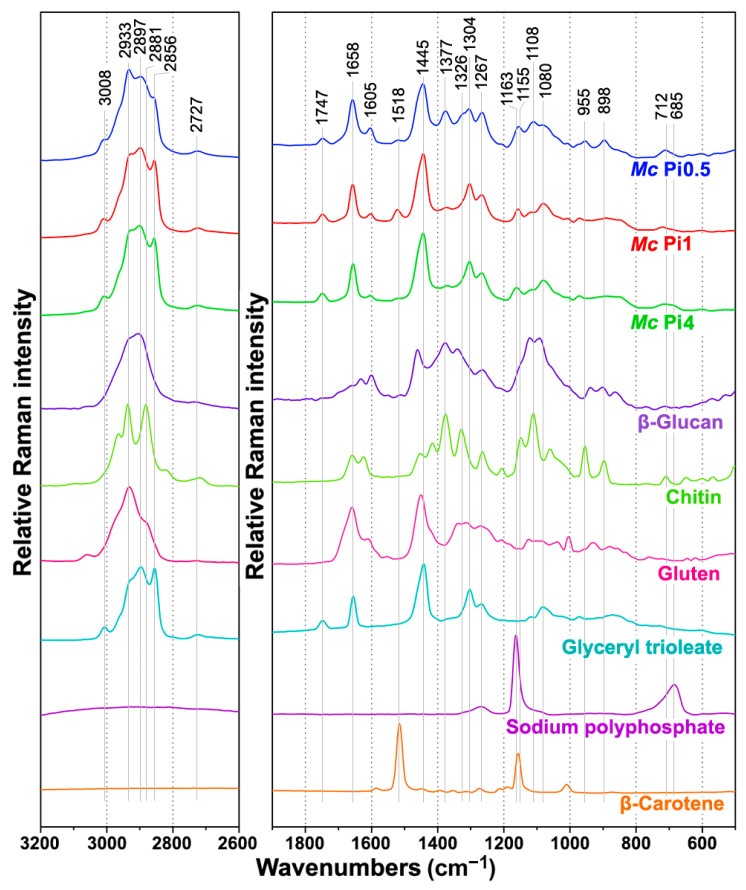
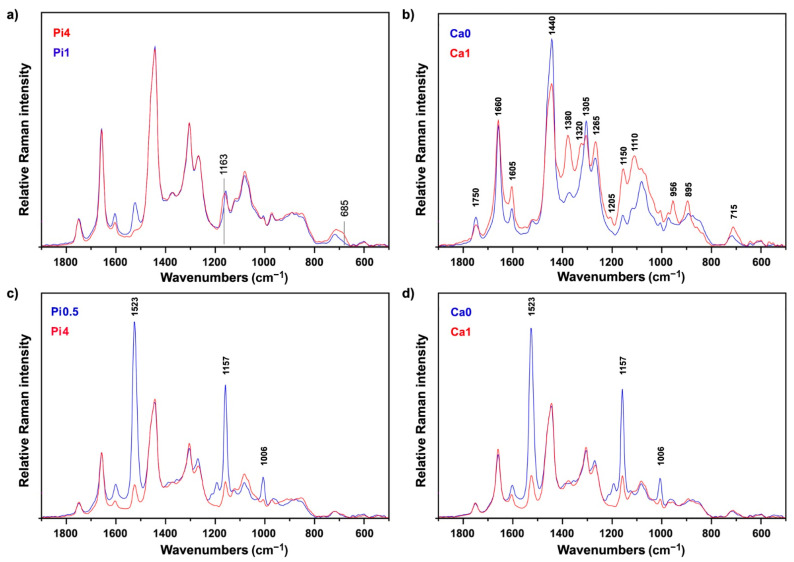
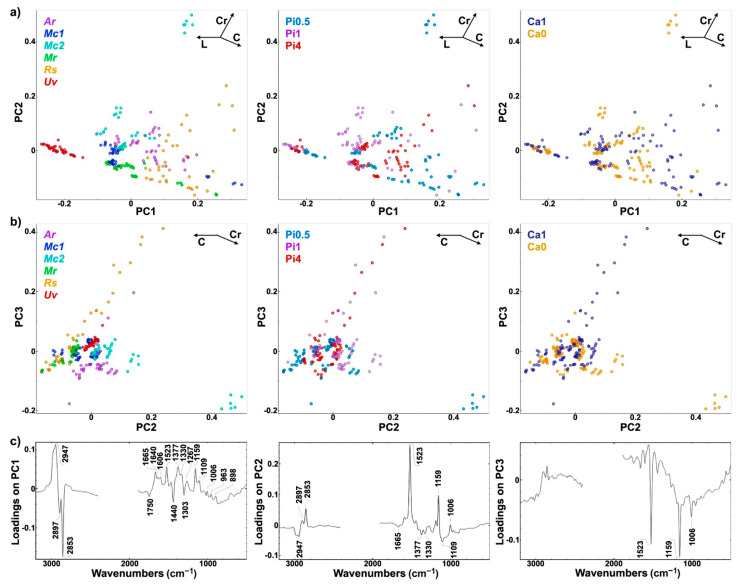
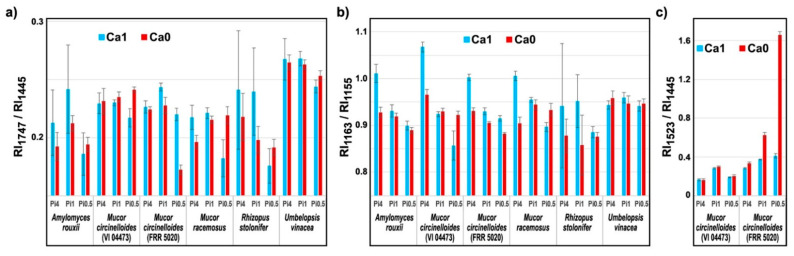
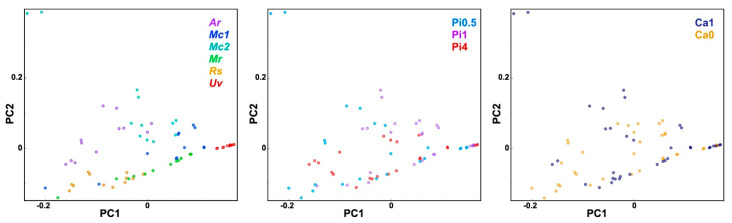
Oleaginous filamentous fungi can accumulate large amount of cellular lipids and biopolymers and pigments and potentially serve as a major source of biochemicals for food, feed, chemical, pharmaceutical, and transport industries. We assessed suitability of Fourier transform (FT) Raman spectroscopy for screening and process monitoring of filamentous fungi in biotechnology. Six Mucoromycota strains were cultivated in microbioreactors under six growth conditions (three phosphate concentrations in the presence and absence of calcium). FT-Raman and FT-infrared (FTIR) spectroscopic data was assessed in respect to reference analyses of lipids, phosphorus, and carotenoids by using principal component analysis (PCA), multiblock or consensus PCA, partial least square regression (PLSR), and analysis of spectral variation due to different design factors by an ANOVA model. All main chemical biomass constituents were detected by FT-Raman spectroscopy, including lipids, proteins, cell wall carbohydrates, and polyphosphates, and carotenoids. FT-Raman spectra clearly show the effect of growth conditions on fungal biomass. PLSR models with high coefficients of determination (0.83-0.94) and low error (approximately 8%) for quantitative determination of total lipids, phosphates, and carotenoids were established. FT-Raman spectroscopy showed great potential for chemical analysis of biomass of oleaginous filamentous fungi. The study demonstrates that FT-Raman and FTIR spectroscopies provide complementary information on main fungal biomass constituents.

Keywords: biodiesel; biopolymers; carotenoids; chitin; chitosan; fatty acids; fermentation; fungi; oleaginous microorganisms; pigments.


Conflict of interest statement

The authors declare no conflict of interest. The funders had no role in the design of the study; in the collection, analyses, or interpretation of data; in the writing of the manuscript, or in the decision to publish the results.

Figures

Figure 1
Figure 1
Total lipids content of the fungal samples grown under six different conditions (average values and range based on measurements of two biological replicates).
Figure 2
Figure 2
(a) Image of disintegrated fungal biomass of samples grown under Pi0.5 condition, with (Ca1, tube1) and without (Ca0, tube 2) calcium. (b) Total carotenoid content of the two Mucor circinelloides strains grown under six different conditions (average values and range based on measurements of two biological replicates).
Figure 3
Figure 3
FT-Raman spectra of Rhizopus stolonifer cultivated under Ca1 condition and two different phosphate concentrations. The spectrum of the sample cultivated under high phosphate concentration (Pi4, red) shows a significant heating effect resulting with a distorted baseline even when measured under low excitation laser power (200 mW), compared to the spectrum of the sample cultivated under low phosphate concentration (Pi0.5, blue), which was measured under the standard laser power (500 mW).
Figure 4
Figure 4
FT-Raman spectra of Mucoromycota oleaginous filamentous fungi cultivated under the standard growth condition (Ca1 and Pi1): Amylomyces rouxii (Ar), Mucor circinelloides VI 04473 (Mc1), Mucor circinelloides FRR 5020 (Mc2), Mucor racemosus (Mr), Rhizopus stolonifer (Rs), and Umbelopsis vinacea (Uv). All spectra were preprocessed and plotted with offset for better viewing.
Figure 5
Figure 5
FT-Raman spectra of Mucor circinelloides (Mc) strain VI 04473 cultivated under Ca1 conditions and three different phosphate concentrations, and of six reference compounds: β-glucan, chitin, gluten, glyceryl trioleate, sodium polyphosphate, and β-carotene. All spectra were preprocessed and plotted with offset for better viewing.
Figure 6
Figure 6
Influence of growth conditions on FT-Raman spectra of fungal biomass. Preprocessed FT-Raman spectra of: (a) Mucor circinelloides strain VI 04473 cultivated under reference calcium condition (Ca1) and two different phosphate concentrations, (b) Mucor circinelloides strain VI 04473 cultivated under low phosphates (Pi0.5) and two different calcium conditions (Ca0 and Ca1), (c) Mucor circinelloides strain FRR 5020 cultivated under absence of calcium (Ca0) and two different phosphate conditions (Pi0.5 and Pi4), and (d) Mucor circinelloides strain FRR 5020 cultivated under low phosphates (Pi0.5) and two different calcium conditions (Ca0 and Ca1).
Figure 7
Figure 7
PCA of FT-Raman spectra of fungi grown at different phosphates and calcium concentrations. (a) Score plots of PC1 and PC2, (b) PC2 and PC3, and (c) the first three loading vectors. Score plots are labeled according to strains: Amylomyces rouxii (Ar), Mucor circinelloides VI 04473 (Mc1), Mucor circinelloides FRR 5020 (Mc2), Mucor racemosus (Mr), Rhizopus stolonifer (Rs), and Umbelopsis vinacea (Uv) (left), phosphates concentrations (middle), and calcium availability (right). Vectors are approximating the increase in relative amount of the metabolites: lipids (L), cell wall carbohydrates (C), and carotenoids (Cr). The explained variances for the first five principal components are 47.3%, 26.9%, 15.8%, 3.8%, and 1.4%.
Figure 8
Figure 8
Ratio of Raman intensities at different wavenumbers related to chemical constituents of fungal biomass cultivated in six different growth conditions (phosphates concentrations and calcium availability). Ratio of Raman intensities at: (a) 1747 and 1445 cm−1 related to lipids, (b) 1163 and 1155 cm−1 related to polyphosphates, and (c) 1523 and 1445 cm−1 related to carotenoids (average values and error is based on measurements of two biological replicates and three technical replicates). Analysis was based on nonderivative FT-Raman data.
Figure 9
Figure 9
Multiblock or consensus principal component analysis (CPCA) of FTIR and FT-Raman spectroscopic data. Global score values of the CPCA are labeled according to strains: Amylomyces rouxii (Ar), Mucor circinelloides VI 04473 (Mc1), Mucor circinelloides FRR 5020 (Mc2), Mucor racemosus (Mr), Rhizopus stolonifer (Rs), and Umbelopsis vinacea (Uv) (left), phosphates concentrations (middle), and calcium availability (right). The explained variances for the first two principal components are 40.8% and 30.9%.
Figure 10
Figure 10
Variation contribution (%) of the design factors in FTIR and FT-Raman data sets. Spectral variation from calcium availability (blue), phosphates concentration (red), calcium–phosphates interaction (yellow), biological replicates (purple), and residuals (green) in: (a) FTIR and (b) FT-Raman spectral data (nonderivative data, averaged technical replicates).

Similar articles

Cited by

References

    1. Meyer V., Basenko E.Y., Benz J.P., Braus G.H., Caddick M.X., Csukai M., de Vries R.P., Endy D., Frisvad J.C., Gunde-Cimerman N., et al. Growing a circular economy with fungal biotechnology: A white paper. Fungal Biol. Biotechnol. 2020;7:5. doi: 10.1186/s40694-020-00095-z. - DOI - PMC - PubMed
    1. Meyer V., Andersen M.R., Brakhage A.A., Braus G.H., Caddick M.X., Cairns T.C., de Vries R.P., Haarmann T., Hansen K., Hertz-Fowler C., et al. Current challenges of research on filamentous fungi in relation to human welfare and a sustainable bio-economy: A white paper. Fungal Biol. Biotechnol. 2016;3:6. doi: 10.1186/s40694-016-0024-8. - DOI - PMC - PubMed
    1. Gupta V.K., Treichel H., Shapaval V., Oliveira L.A.d., Tuohy M.G. Microbial Functional Foods and Nutraceuticals. John Wiley & Sons; Hoboken, NJ, USA: 2017. pp. 1–309.
    1. Papanikolaou S., Galiotou-Panayotou M., Fakas S., Komaitis M., Aggelis G. Lipid production by oleaginous Mucorales cultivated on renewable carbon sources. Eur. J. Lipid Sci. Technol. 2007;109:1060–1070. doi: 10.1002/ejlt.200700169. - DOI
    1. Qiao W.C., Tao J.Q., Luo Y., Tang T.H., Miao J.H., Yang Q.W. Microbial oil production from solid-state fermentation by a newly isolated oleaginous fungus, Mucor circinelloides Q531 from mulberry branches. R. Soc. Open Sci. 2018;5 doi: 10.1098/rsos.180551. - DOI - PMC - PubMed