. 2021 Jun 23;10(7):1581.
doi: 10.3390/cells10071581.

Morphological and Calcium Signaling Alterations of Neuroglial Cells in Cerebellar Cortical Dysplasia Induced by Carmustine

Affiliations

Morphological and Calcium Signaling Alterations of Neuroglial Cells in Cerebellar Cortical Dysplasia Induced by Carmustine

Cynthia Alejandra Rodríguez-Arzate et al. Cells. .

Abstract

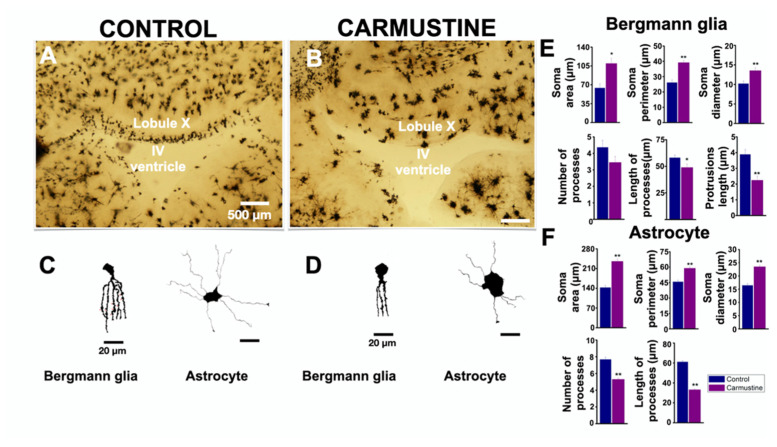
Cortical dysplasias are alterations in the organization of the layers of the brain cortex due to problems in neuronal migration during development. The neuronal component has been widely studied in experimental models of cortical dysplasias. In contrast, little is known about how glia are affected. In the cerebellum, Bergmann glia (BG) are essential for neuronal migration during development, and in adult they mediate the control of fine movements through glutamatergic transmission. The aim of this study was to characterize the morphology and intracellular calcium dynamics of BG and astrocytes from mouse cerebellum and their modifications in a model of cortical dysplasia induced by carmustine (BCNU). Carmustine-treated mice were affected in their motor coordination and balance. Cerebellar dysplasias and heterotopias were more frequently found in lobule X. Morphology of BG cells and astrocytes was affected, as were their spontaneous [Ca2+]i transients in slice preparation and in vitro.

Keywords: Bergmann glia; astrocytes; clarity; light-sheet fluorescence microscopy.


Conflict of interest statement

The authors declare no conflict of interest.

Figures

Figure 1
Figure 1
Deficiencies in motor coordination of carmustine-treated mice. Comparative analysis between control and carmustine-treated groups. (A). Mice treated with carmustine spent less time on an accelerating rotarod; this was significantly different in trials 1 and 5 (p < 0.05). (B). The speed at which the carmustine-treated group fell was slower in the six trials, but statistically significant only in trial 1 (p < 0.05). (C). The carmustine-treated group traveled a shorter distance throughout the test, but statistically significant in trials 2 and 5 (p < 0.05). (D). The average latency to fall is shown for each group (Ctrl 37.64 ± 1.49 s, Carmustine 26.45 ± 1.86 s) **. (E). The average speed at fall is shown for each group (Ctrl 16.03 ± 0.42 rpm, Carmustine 12.83 ± 0.59 rpm) **. (F) The average distance traveled is shown for each group (Ctrl 5.48 ± 0.31 m, Carmustine 3.26 ± 0.30 m) **. (Control n = 6, Carmustine n = 6). Data are represented as the mean ± the standard error of the mean. * indicates significant difference (p < 0.05) and ** indicates significant difference (p < 0.001) both compared to the control group.
Figure 2
Figure 2
Morphological evidence of cortical dysplasia in the cerebellum. (A). Five-day-old male GFAP-eGFP transgenic mouse brain, before (A) and after clarification (B,C). Dorsal view of the brain in (B) reconstructed by light sheet microscopy. (D). Coronal section of the cerebellum of a male P5 GFAP-eGFP transgenic control mouse. (E). Coronal section of the cerebellum of a male P5 GFAP-GFP transgenic mouse treated with carmustine showing the presence of cortical dysplasias in the lobules in contact with the IV ventricle (F). Magnification of the square in (D); here Bergmann cells are situated in the Purkinje cell layer, projecting their processes through the molecular layer. (G). Magnification of the square in (E), where Bergmann cells are seen displaced towards the granular layer (orange arrowheads) and the molecular layer (white arrowhead) with disrupted processes (gray arrowhead); as well as the presence of cell clusters and heterotopias evidenced in the Purkinje cell layer (red arrowhead) and ependymal cell layer (blue arrowhead). (Control n = 5, Carmustine n = 5) Green: GFAP + glial cells. ML: molecular layer, PCL: Purkinje cell layer, GCL: granule cell layer, ECL: ependymal cell layer.
Figure 3
Figure 3
Carmustine treatment reduced morphological complexity of glial cells. (A). Coronal section at the level of lobule X of the cerebellum processed by Golgi-Cox staining. (B). A sample image of the same region showing a cortical dysplasia. Notice the malformation of the shape of the fourth ventricle. (C,D). Representative drawings with camera lucida of a Bergmann cell of lobule X and an astrocyte from cerebellar cortex, control and carmustine respectively. Complexity and extension of the astrocyte processes are observed in the control group, which contrasts with the carmustine-treated group, as fewer and diffuse processes are observed, as well as an increase in the size of the soma. (E,F). Comparative analysis between the control and the carmustine-treated groups (1 to 3 BG cells were analyzed from each experiment; Control n = 6, Carmustine n = 6 and 6 to 8 astrocyte cells were analyzed from each experiment; Control n = 6, Carmustine n = 6). Data are represented as the mean ± the standard error of the mean. * indicates significant difference (p < 0.05) and ** indicates significant difference (p < 0.001) both compared to the control group.
Figure 4
Figure 4
Basal activity of the Bergmann glia is increased in cortical dysplasia. (A,B). Heat maps of the maximum projection image of basal activity of the BG from a sample coronal section of the lobule X of the cerebellum of transgenic GFAP-eGFP male mice (P5). (B). The image reveals higher activity in the carmustine-treated cerebellum, mainly in BG cells (red arrowheads), astrocytes from the granular layer (yellow arrowheads), and ependymal cells (white arrowheads. (C,E). Representative basal (Ca2+) traces of control and carmustine-treated BG cells. More cells were engaged in calcium activity in the carmustine-treated animals. Notice the differences in the activity kinetics. (D,F). At the end of the recordings, application of ATP (black arrowhead) increased the (Ca2+) fluorescence (dF/F0) response in all BG. (G). Comparative analysis between the control and carmustine-treated groups. BG cells from carmustine-treated mice presented more cells with spontaneous Ca2+ activity, but with a reduced number of Ca2+ transient events per cell. BG also exhibited shorter duration and reduced rise-and-fall kinetics time in these events. An average of 83.5 ± 6.11 Bergmann cells responded to ATP in the recorded area of each experimental slice (Control n = 6), whereas 76.25 ± 2.39 Bergmann cells responded to ATP in carmustine-treated slices (Carmustine n = 5 pups, each from a different carmustine-treated mother). Data are represented as the mean ± the standard error of the mean. * indicates significant difference (p < 0.05) and ** indicates significant difference (p < 0.001) both compared to the control group. ML: molecular layer, PCL: Purkinje cell layer, GL: granule cell layer, ECL: ependymal cell layer.
Figure 5
Figure 5
Decreased morphological complexity of carmustine treated astrocytes in vitro. (A,B). Astrocytes from control and carmustine-treated mice. The morphological complexity and extent of astrocyte processes are evident in this representative image at DIV5. (B). Astrocytes from carmustine treated mice showed a reduced number of processes that were retracted. (C). Comparative analysis between the control group and the carmustine-treated group for each parameter: soma area, soma perimeter, soma diameter, number of processes and length of the processes. (3 to 5 astrocyte cells were analyzed from each experiment; Control n = 4, Carmustine n = 4). Data are represented as the mean ± standard error of the mean. ** indicates significant difference (p < 0.001).
Figure 6
Figure 6
Basal activity of cerebellar astrocytes in culture. (A,B). Heat map of the maximum projection images of basal activity from primary cultures of cerebellar astrocytes at DIV5. Representative traces of basal activity of (C) control and (E) carmustine-treated mice. Contrast of the higher activity of astrocytes from carmustine treated mice. Raster plot of the basal activity of (D) control and (F) carmustine-treated astrocytes. The baseline activity of individual astrocytes is shown over time. The Y axis corresponds to the ID of each astrocyte and a dot indicates the time in which a calcium transient event occurred. (G). Comparative analysis between the control and the carmustine-treated group. Astrocytes from carmustine-treated mice culture presented more cells with spontaneous Ca2+ activity, with a higher number of Ca2+ transient events per cell. Astrocytes also showed shorter duration and reduced kinetics of rise and fall time of these events. An average of 87.25 ± 15.36 astrocytes responded to ATP at DIV5 culture, Control n = 4, 8 pups were used, 2 for each control culture; whereas 89.50 ± 12.29 astrocytes responded to ATP at DIV 5, Carmustine n = 4, 8 pups, 2 for each carmustine culture). Data are represented as the mean ± the standard error of the mean. * indicates significant difference (p < 0.05) and ** indicates significant difference (p < 0.001) both compared to the control group.
Figure 7
Figure 7
Global network synchronization in cerebellar astrocytes in culture. (A,B). Representative images of a pairwise synchronization matrix that show the coactive astrocytes exhibiting transient calcium events between all active astrocyte pairs. (C,D). Representative images of core ensemble, defined as a group of coactive astrocytes. Each astrocyte (colored circle) is a node. The nodes that are conserved in all significantly correlated ensembles are in green and the rest are in red. The core ensemble preserves the spatial distribution of the astrocytes in the culture. The calibration bar corresponds to the events in which astrocytes activated together. (87.25 ± 15.36 astrocytes were recruited at DIV5 culture, Control n = 4, 8 pups were used, 2 for each control culture, whereas 89.50 ± 12.29 astrocytes were recruited at DIV 5, Carmustine n = 4, 8 pups, 2 for each carmustine culture).

Similar articles

Cited by

References

    1. Luhmann H.J. Models of cortical-malformation-chemical and physical. J. Neurosci. Methods. 2016;260:62–72. doi: 10.1016/j.jneumeth.2015.03.034. - DOI - PubMed
    1. Barkovich A.J., Kuzniecky R.I., Jackson G.D., Guerrini R., Dobyns W.B. A developmental and genetic classification for malformations of cortical development. Neurology. 2005;65:1873–1887. doi: 10.1212/01.wnl.0000183747.05269.2d. - DOI - PubMed
    1. Baka M., Uyanikgil Y., Ates U. Investigation of maternal metionin effect on the hippocampal formation of newborn rat model or intrauterine cortical dysplasia. Childs Nerv. Syst. 2010;26:1575–1581. doi: 10.1007/s00381-010-1147-5. - DOI - PubMed
    1. Moroni R.F., Inverardi F., Regondi M.C., Ferrucio P., Spreafico R., Frassoni C. Altered spatial distribution of PV-cortical cells and dysmorphic neurons in the somatosensory cortex of BCNU-treated rat model of cortical dysplasia. Epilepsy. 2008;49:882–887. doi: 10.1111/j.1528-1167.2007.01440.x. - DOI - PubMed
    1. Benardete E.A., Kriegstein A.R. Increased excitability and decreased sensitivity to GABA in an animal model of dysplastic cortex. Epilepsy. 2002;43:970–982. doi: 10.1046/j.1528-1157.2002.40901.x. - DOI - PubMed

Publication types

LinkOut - more resources