. 2021 Jun 23;22(13):6726.
doi: 10.3390/ijms22136726.

Analysis of the Role of FRMD5 in the Biology of Papillary Thyroid Carcinoma

Affiliations

Analysis of the Role of FRMD5 in the Biology of Papillary Thyroid Carcinoma

Agata M Gaweł et al. Int J Mol Sci. .

Abstract

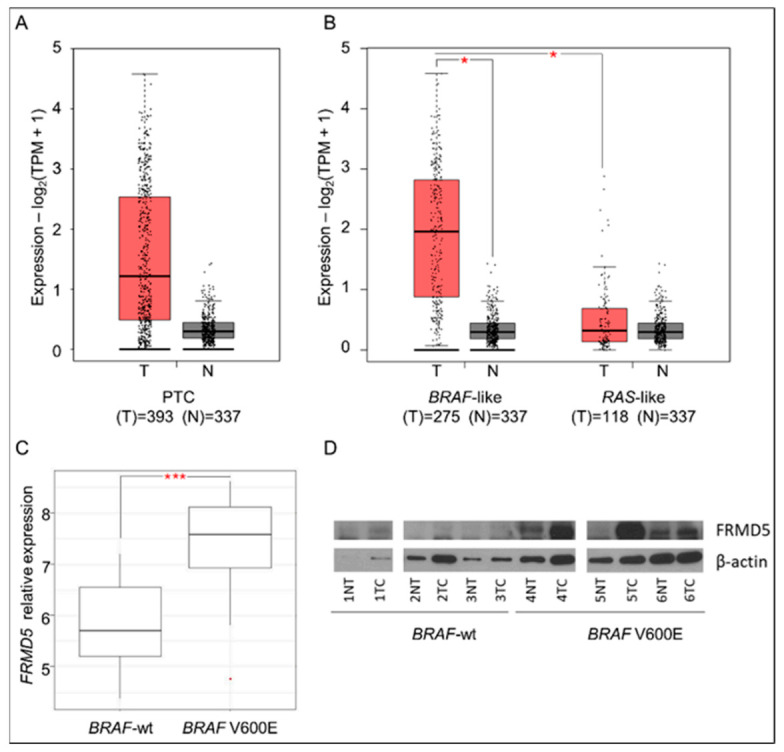
Background: Thyroid carcinoma (TC) is the most common endocrine system malignancy, and papillary thyroid carcinoma (PTC) accounts for >80% of all TC cases. Nevertheless, PTC pathogenesis is still not fully understood. The aim of the study was to elucidate the role of the FRMD5 protein in the regulation of biological pathways associated with the development of PTC. We imply that the presence of certain genetic aberrations (e.g., BRAF V600E mutation) is associated with the activity of FRMD5.

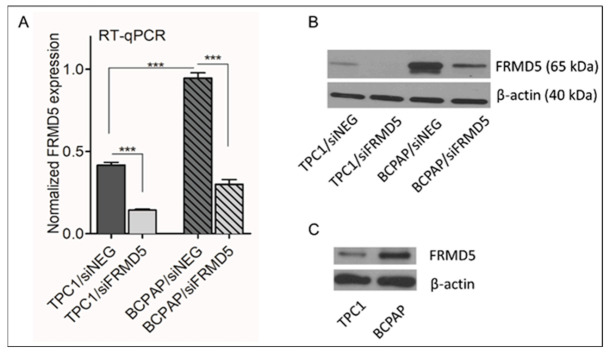
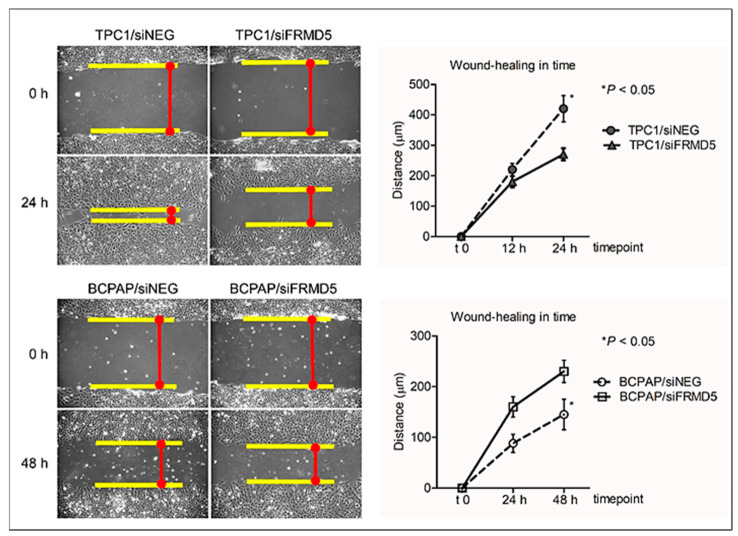
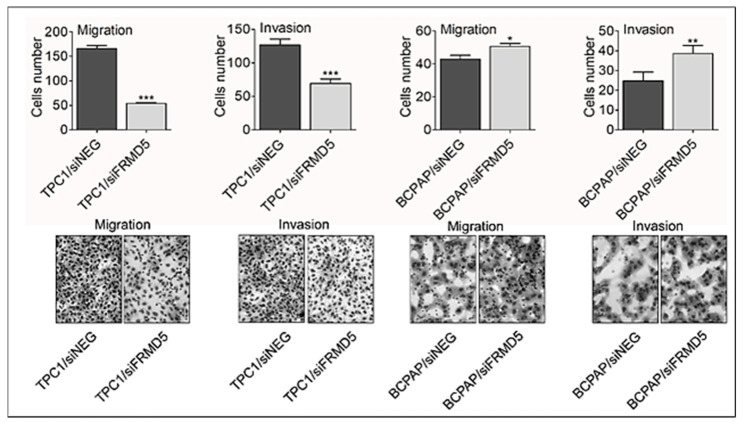
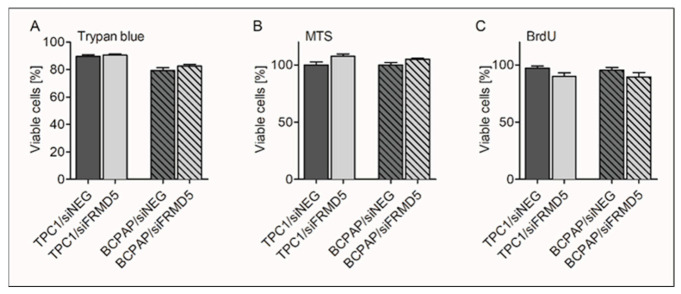
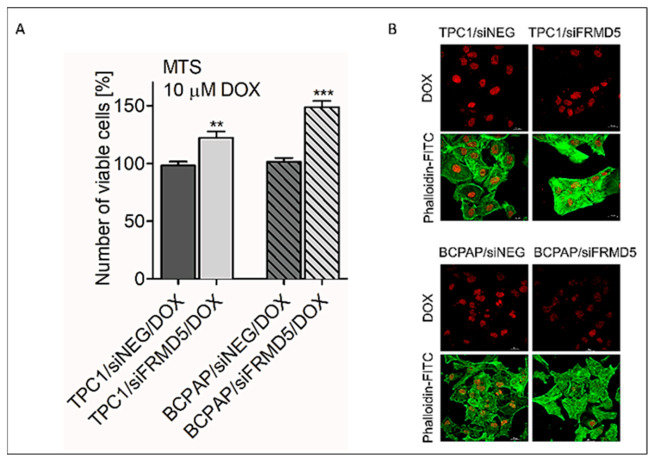
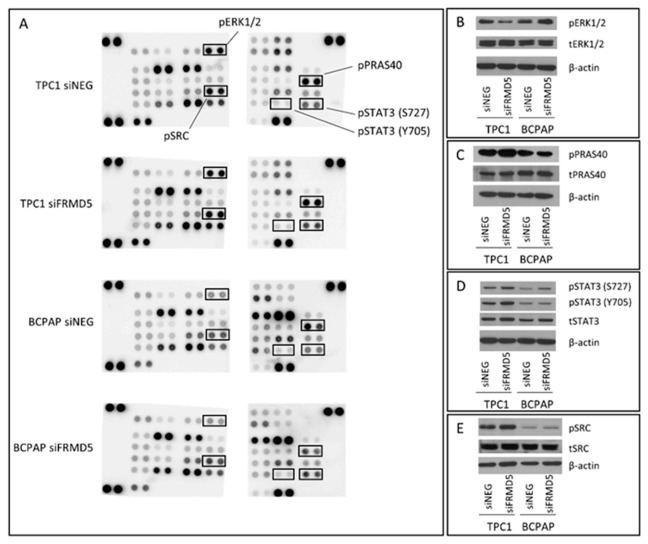
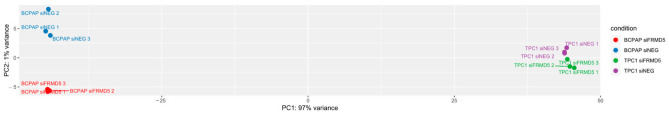
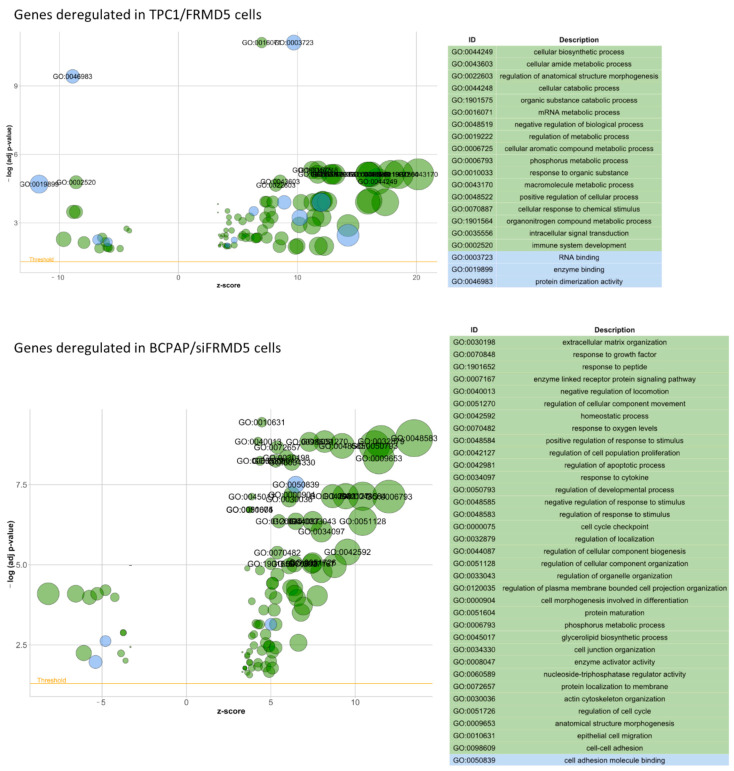
Methods: The studies were conducted on TPC1 and BCPAP (BRAF V600E) model PTC-derived cells. Transfection with siRNA was used to deplete the expression of FRMD5. The mRNA expression and protein yield were evaluated using RT-qPCR and Western blot techniques. Proliferation, migration, invasiveness, adhesion, spheroid formation, and survival tests were performed. RNA sequencing and phospho-kinase proteome profiling were used to assess signaling pathways associated with the FRMD5 expressional status.

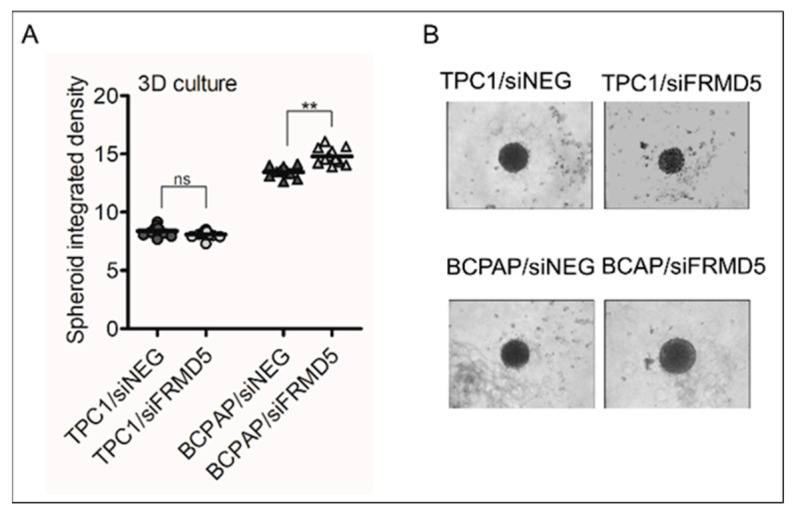
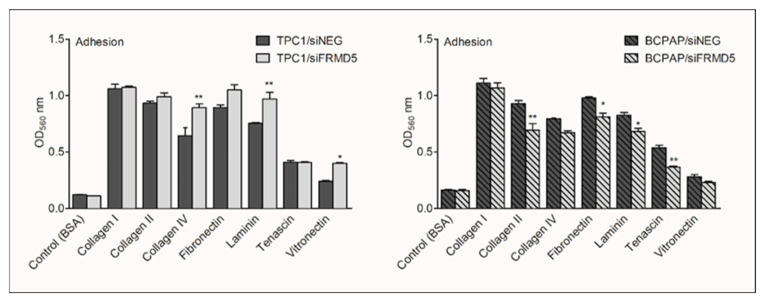
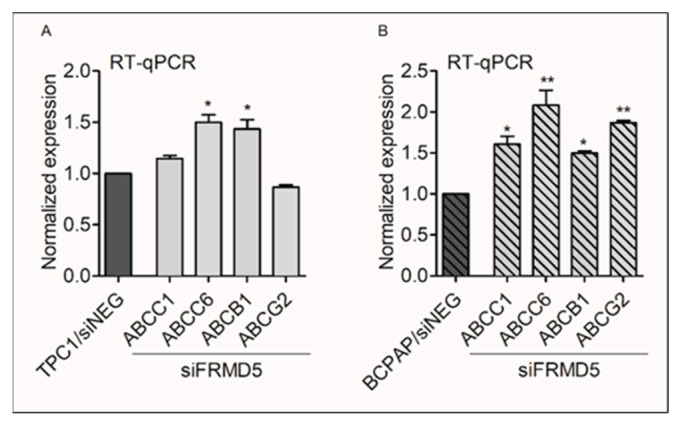
Results: The obtained data indicate that the expression of FRMD5 is significantly enhanced in BRAF V600E tumor specimens and cells. It was observed that a drop in intracellular yield of FRMD5 results in significant alternations in the migration, invasiveness, adhesion, and spheroid formation potential of PTC-derived cells. Importantly, significant divergences in the effect of FRMD5 depletion in both BRAF-wt and BRAF-mutated PTC cells were observed. It was also found that knockdown of FRMD5 significantly alters the expression of multidrug resistant genes.

Conclusions: This is the first report highlighting the importance of the FRMD5 protein in the biology of PTCs. The results suggest that the FRMD5 protein can play an important role in controlling the metastatic potential and multidrug resistance of thyroid tumor cells.

Keywords: BRAF V600E; FRMD5; RNA sequencing; migration; papillary thyroid carcinoma.


Conflict of interest statement

The authors declare no conflict of interest. The funders had no role in the design of the study; in the collection, analyses, or interpretation of data; in the writing of the manuscript, or in the decision to publish the results.

Figures

Figure 1
Figure 1
Analysis of FRMD5 expression in human thyroid tissues. (A) Boxplot of FRMD5 gene expression in papillary thyroid cancer (PTC) sections using The Cancer Genome Atlas (TCGA) databases and the Genotype Tissue Expression (GTEx) (tumor (T) vs. non-cancerous tissue (N)). (B) Boxplot of FRMD5 gene expression in BRAF-like and RAS-like PTC subtypes vs. non-cancerous tissues. (C) Boxplot of FRMD5 gene expression in PTC bearing the wild-type (BRAF-wt) and mutated BRAF (BRAF V600E) gene determined by microarray analysis. (D) Western blot analysis of FRMD5 protein expression in BRAF-wt and BRAF V600E PTCs and non-tumoral (NT) tissues. β-actin serves as a loading control. Data are presented as mean ± SD.* p < 0.05; *** p < 0.0001.
Figure 2
Figure 2
FRMD5 expression at transcript (A; RT-qPCR) and protein level (B; Western blot) in TPC1 and BCPAP cell lines transfected with FRMD5-specific siRNA (siFRMD5) and a scrambled control (siNEG). (C) Native yield of FRMD5 in non-transfected TPC1 and BCPAP cells determined by Western blot. β-actin served as a loading control. Graphical data are presented as mean ± SD. *** p < 0.0001.
Figure 3
Figure 3
Silencing of FRMD5 results in discrepant migratory and invasive potentials of TPC1 and BCPAP cells. The left panel shows representative images (10× lens) of wounds in monolayers of TPC1 and BCPAP cells transfected with siNEG (controls) or siFRMD5, at two time points: t0 (scratch area at time point 0) and t2 (scratch area at time point 24 h for TPC1 and 48 h for BCPAP) after scratch application. The right panel shows a graphical analysis of relative migration of transfected cells measured at t0, t1 (scratch area at time point 12 h for TPC1 and 24 h for BCPAP), and t2 time after scratch application. The cell migration distance was calculated by measuring the wound width, dividing it by two, and subtracting this value from the initial half-wound width. Data are presented as mean ± SD. * p < 0.05.
Figure 4
Figure 4
FRMD5 depletion alters the migration and invasion capacities of TPC1 and BCPAP cells. Cells were resuspended in null medium and seeded in migration and Matrigel invasion insert chambers (8-µm pore size), then placed in 24-well plates filled with medium containing a chemoattractant (10% fetal bovine serum; FBS). After 24 h of incubation, the migrated cells were stained and photographed using a light microscope equipped with a camera (40× lens). Representative images are shown on the bottom panel. The obtained data indicating the number of migrated cells are presented on the graphs (top panel). FRMD5-knockdown significantly reduced migration and invasiveness of TPC1 cells. Depletion of FRMD5 promoted motility of BCPAP cells. Data are presented as mean ± SD. * p < 0.05; ** p < 0.001; *** p < 0.0001.
Figure 5
Figure 5
FRMD5-knockdown affects the growth of tumor spheroids. TPC1 and BCPAP cells deficient in FRMD5 and grown in a 3D model present significantly reduced or increased dimensions and shape of the formed spheroids, respectively. (A) Graphical plots summarizing the average integrated density of spheroids formed by cells treated with siNEG (controls) or siFRMD5. (B) Representative images of the formed spheroids on day 6. Magnification: 10× lens. Data are presented as mean ± SD. ** p < 0.001; ns, non-significant.
Figure 6
Figure 6
Effect of FRMD5 silencing on the viability of TPC1 and BCPAP cells. (A) Trypan blue dye exclusion assay; (B) MTS-based cells viability analysis; (C) BrdU-based cell proliferation assay. Data showed non-significant changes in viability and proliferation between the control (siNEG) and siFRMD5-deficient cells. Data are expressed as mean ± SD.
Figure 7
Figure 7
FRMD5-knockdown affects cell-extracellular matrix (ECM) interactions of TPC1 and BCPAP cells. The left and right panel shows adhesion assay performed on TPC1 and BCPAP cells, respectively. Data are expressed as optical density (OD560), which refers to the number of attached cells. The graphs present the fraction of attached cells to collagen I-, collagen II-, collagen IV-, fibronectin-, laminin-, tenascin-, and vitronectin-coated wells. Bovine serum albumin (BSA)-coated wells served as a negative control. Gray bars mark FRMD5-silenced cells, and dark-color bars indicate cells treated with control siRNA (siNEG). Data are presented as mean ± SD. * p < 0.05; ** p < 0.001.
Figure 8
Figure 8
Knockdown of FRMD5 significantly affects the expression patterns of the multidrug resistance (MDR) genes in TPC1 and BCPAP cells. Transcript-level expression analysis of MDR genes in TPC1 (A) and BCPAP (B) cell lines transfected with FRMD5-specific siRNA (siFRMD5) or siNEG (control) using RT-qPCR. Graphical data are presented as mean ± SD. * p < 0.05; ** p < 0.001.
Figure 9
Figure 9
Knockdown of FRMD5 affects chemoresistance of TPC1 and BCPAP cells. (A) MTS-based analysis of FRMD5-deficient TPC1 and BCPAP cells exposed to doxorubicin (DOX) for 24 h. (B) Representative confocal microscopy images display intracellular DOX accumulation (red signal) in fluorescently labeled (fluorescein isothiocyanate (FITC)-conjugated phalloidin; green signal) cells. Images were recorded using 63×/1.4 oil DIC M27 lens. Cells treated with non-targeting siRNA (siNEG) were used as a control. Graphical data are presented as mean ± SD. ** p < 0.001; *** p < 0.0001.
Figure 10
Figure 10
Analysis of the impact of FRMD5 depletion on signal transduction pathways in the TPC1 and BCPAP cell lines. (A) Human phospho-kinase array analysis of cells transfected with FRMD5-specific siRNA (siFRMD5) and non-targeting siRNA (siNEG; control). (BE) Verification of human phospho-kinase array results using the Western blot technique. β-actin served as a loading control.
Figure 11
Figure 11
Principal component analysis (PCA) of RNA sequencing (RNA-Seq) datasets for FRMD5-knocked-down TPC1 and BCPAP cell lines. PCA was determined from the abundance of all transcripts detected in RNA-Seq analysis. Cells transfected with non-targeting small interfering RNA are marked as siNEG (control). Cells transfected with FRMD5-specific siRNA are marked as TPC1/siFRMD5 and BCPAP/siFRMD5.
Figure 12
Figure 12
Bubble plots of significantly enriched Gene Ontology (GO) terms for the FRMD5-depleted TPC1 (top panel) and BCPAP (bottom panel) cells after term similarity reduction. Terms with adjusted p-value on the PHRED scale higher than 4 (TPC1) and 5 (BCPAP) are annotated. The area of the circles is proportional to the number of genes assigned to the term in the analysis. The z-score (horizontal axis) indicates whether the given term is more likely to be up- or downregulated. The threshold indicates the adjusted p < 0.05.

References

    1. Bray F., Ferlay J., Soerjomataram I., Siegel R.L., Torre L.A., Jemal A. Global cancer statistics 2018: GLOBOCAN estimates of incidence and mortality worldwide for 36 cancers in 185 countries. CA Cancer J. Clin. 2018;68:394–424. doi: 10.3322/caac.21492. - DOI - PubMed
    1. Fagin J.A., Wells S.A. Biologic and Clinical Perspectives on Thyroid Cancer. N. Engl. J. Med. 2016;375:1054–1067. doi: 10.1056/NEJMra1501993. - DOI - PMC - PubMed
    1. Miranda-Filho A., Lortet-Tieulent J., Bray F., Cao B., Franceschi S., Vaccarella S., Maso L.D. Thyroid cancer incidence trends by histology in 25 countries: A population-based study. Lancet Diabetes Endocrinol. 2021;9:225–234. doi: 10.1016/S2213-8587(21)00027-9. - DOI - PubMed
    1. Nikiforov Y.E. RET/PTC Rearrangement in Thyroid Tumors. Endocr. Pathol. 2002;13:03–16. doi: 10.1385/EP:13:1:03. - DOI - PubMed
    1. Howell G.M., Hodak S.P., Yip L. RAS Mutations in Thyroid Cancer. Oncologist. 2013;18:926–932. doi: 10.1634/theoncologist.2013-0072. - DOI - PMC - PubMed

MeSH terms