Genotype Load Modulates Amyloid Burden and Anxiety-Like Patterns in Male 3xTg-AD Survivors despite Similar Neuro-Immunoendocrine, Synaptic and Cognitive Impairments
- PMID: 34201608
- PMCID: PMC8301351
- DOI: 10.3390/biomedicines9070715
Genotype Load Modulates Amyloid Burden and Anxiety-Like Patterns in Male 3xTg-AD Survivors despite Similar Neuro-Immunoendocrine, Synaptic and Cognitive Impairments
Abstract
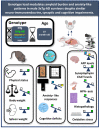
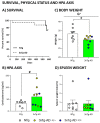
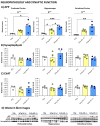
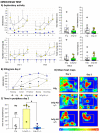
The wide heterogeneity and complexity of Alzheimer's disease (AD) patients' clinical profiles and increased mortality highlight the relevance of personalized-based interventions and the need for end-of-life/survival predictors. At the translational level, studying genetic and age interactions in a context of different levels of expression of AD-genetic-load can help to understand this heterogeneity better. In the present report, a singular cohort of long-lived (19-month-old survivors) heterozygous and homozygous male 3xTg-AD mice were studied to determine whether their AD-genotype load can modulate the brain and peripheral pathological burden, behavioral phenotypes, and neuro-immunoendocrine status, compared to age-matched non-transgenic controls. The results indicated increased amyloid precursor protein (APP) levels in a genetic-load-dependent manner but convergent synaptophysin and choline acetyltransferase brain levels. Cognitive impairment and HPA-axis hyperactivation were salient traits in both 3xTg-AD survivor groups. In contrast, genetic load elicited different anxiety-like profiles, with hypoactive homozygous, while heterozygous resembled controls in some traits and risk assessment. Complex neuro-immunoendocrine crosstalk was also observed. Bodyweight loss and splenic, renal, and hepatic histopathological injury scores provided evidence of the systemic features of AD, despite similar peripheral organs' oxidative stress. The present study provides an interesting translational scenario to study further genetic-load and age-dependent vulnerability/compensatory mechanisms in Alzheimer's disease.
Keywords: Alzheimer’s disease; BPSD; NPS; end-of-life; frailty; genetic load; heterogeneity; neuro-immunoendocrine crosstalk; survival.
Conflict of interest statement
The authors declare no conflict of interest.
Figures

Similar articles
-
Crosstalk of Alzheimer's disease-phenotype, HPA axis, splenic oxidative stress and frailty in late-stages of dementia, with special concerns on the effects of social isolation: A translational neuroscience approach.Front Aging Neurosci. 2022 Sep 15;14:969381. doi: 10.3389/fnagi.2022.969381. eCollection 2022. Front Aging Neurosci. 2022. PMID: 36185472 Free PMC article.
-
Survival Curves and Behavioral Profiles of Female 3xTg-AD Mice Surviving to 18-Months of Age as Compared to Mice with Normal Aging.J Alzheimers Dis Rep. 2017 Jul 6;1(1):47-57. doi: 10.3233/ADR-170011. J Alzheimers Dis Rep. 2017. PMID: 30480229 Free PMC article.
-
Long-term Treatment with Low-Dose Caffeine Worsens BPSD-Like Profile in 3xTg-AD Mice Model of Alzheimer's Disease and Affects Mice with Normal Aging.Front Pharmacol. 2018 Feb 15;9:79. doi: 10.3389/fphar.2018.00079. eCollection 2018. Front Pharmacol. 2018. PMID: 29497377 Free PMC article.
-
Sex-dependent worsening of NMDA-induced responses, anxiety, hypercortisolemia, and organometry of early peripheral immunoendocrine impairment in adult 3xTg-AD mice and their long-lasting ontogenic modulation by neonatal handling.Behav Brain Res. 2023 Feb 13;438:114189. doi: 10.1016/j.bbr.2022.114189. Epub 2022 Nov 4. Behav Brain Res. 2023. PMID: 36343697
-
Physical exercise protects against Alzheimer's disease in 3xTg-AD mice.J Alzheimers Dis. 2011;24(3):421-54. doi: 10.3233/JAD-2011-101635. J Alzheimers Dis. 2011. PMID: 21297257
Cited by
-
Crosstalk of Alzheimer's disease-phenotype, HPA axis, splenic oxidative stress and frailty in late-stages of dementia, with special concerns on the effects of social isolation: A translational neuroscience approach.Front Aging Neurosci. 2022 Sep 15;14:969381. doi: 10.3389/fnagi.2022.969381. eCollection 2022. Front Aging Neurosci. 2022. PMID: 36185472 Free PMC article.
-
The Impact of C-3 Side Chain Modifications on Kynurenic Acid: A Behavioral Analysis of Its Analogs in the Motor Domain.Int J Mol Sci. 2024 Mar 16;25(6):3394. doi: 10.3390/ijms25063394. Int J Mol Sci. 2024. PMID: 38542368 Free PMC article.
-
Anxiety and Alzheimer's disease pathogenesis: focus on 5-HT and CRF systems in 3xTg-AD and TgF344-AD animal models.Front Aging Neurosci. 2023 Nov 10;15:1251075. doi: 10.3389/fnagi.2023.1251075. eCollection 2023. Front Aging Neurosci. 2023. PMID: 38076543 Free PMC article. Review.
-
Editorial of Special Issue 'Dissecting Neurological and Neuropsychiatric Diseases: Neurodegeneration and Neuroprotection'.Int J Mol Sci. 2022 Jun 23;23(13):6991. doi: 10.3390/ijms23136991. Int J Mol Sci. 2022. PMID: 35805990 Free PMC article.
-
Survival Bias, Non-Lineal Behavioral and Cortico-Limbic Neuropathological Signatures in 3xTg-AD Mice for Alzheimer's Disease from Premorbid to Advanced Stages and Compared to Normal Aging.Int J Mol Sci. 2023 Sep 7;24(18):13796. doi: 10.3390/ijms241813796. Int J Mol Sci. 2023. PMID: 37762098 Free PMC article.
References
Grants and funding
LinkOut - more resources
Full Text Sources

