Review
. 2021 Jun 23;22(13):6730.
doi: 10.3390/ijms22136730.

Can Developments in Tissue Optical Clearing Aid Super-Resolution Microscopy Imaging?

Affiliations
Review

Can Developments in Tissue Optical Clearing Aid Super-Resolution Microscopy Imaging?

Paweł Matryba et al. Int J Mol Sci. .

Abstract

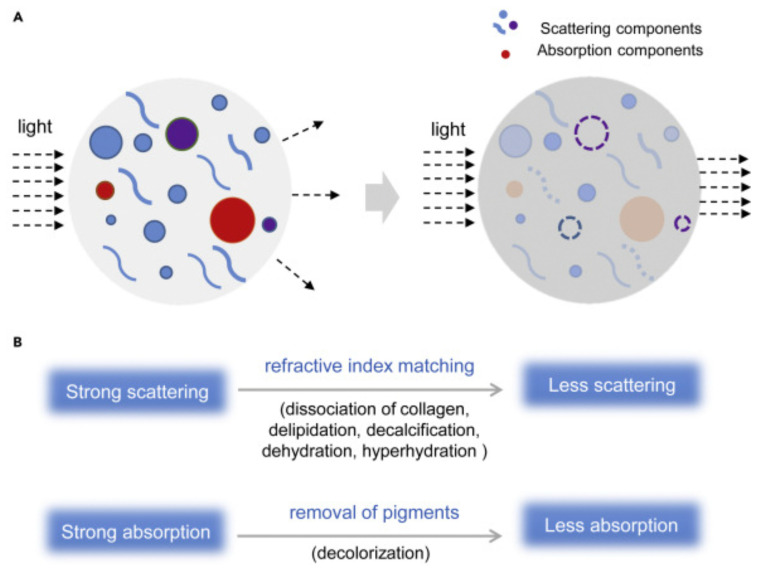
The rapid development of super-resolution microscopy (SRM) techniques opens new avenues to examine cell and tissue details at a nanometer scale. Due to compatibility with specific labelling approaches, in vivo imaging and the relative ease of sample preparation, SRM appears to be a valuable alternative to laborious electron microscopy techniques. SRM, however, is not free from drawbacks, with the rapid quenching of the fluorescence signal, sensitivity to spherical aberrations and light scattering that typically limits imaging depth up to few micrometers being the most pronounced ones. Recently presented and robustly optimized sets of tissue optical clearing (TOC) techniques turn biological specimens transparent, which greatly increases the tissue thickness that is available for imaging without loss of resolution. Hence, SRM and TOC are naturally synergistic techniques, and a proper combination of these might promptly reveal the three-dimensional structure of entire organs with nanometer resolution. As such, an effort to introduce large-scale volumetric SRM has already started; in this review, we discuss TOC approaches that might be favorable during the preparation of SRM samples. Thus, special emphasis is put on TOC methods that enhance the preservation of fluorescence intensity, offer the homogenous distribution of molecular probes, and vastly decrease spherical aberrations. Finally, we review examples of studies in which both SRM and TOC were successfully applied to study biological systems.

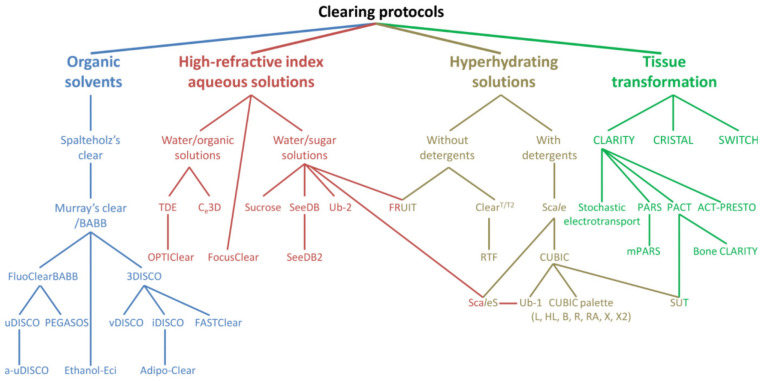
Keywords: CLARITY; CUBIC; DISCO; clearing agents; light sheet; optical clearing; super-resolution; tissue clearing.


Conflict of interest statement

The authors declare no conflict of interest.

Figures

Figure 1
Figure 1
Arborization of the family of TOC protocols. The diagram represents four broad, chemical categories of TOC along with major TOC techniques. Reproduced from Matryba et al. [19] under the terms of the Creative Commons CC-BY-NC license.
Figure 2
Figure 2
(A) Scheme presenting basic physicochemical mechanisms of TOC. (B) TOC relies mainly on the reduction of light scattering (achievable though delipidation, dehydration or hy-perhydration, decalcification and dissociation of collagen fibers) and absorption. Reproduced from Yu et al. [25] under the terms of CC BY-NC-ND 4.0 license.
Figure 3
Figure 3
SeeDB2 allows for deep-tissue imaging with SRM resolution. (A) Tissue blocks of the cerebral cortex from an adult Thy1-YFP-H mouse were cleared with SeeDB2S; (B) upon Airyscan imaging, dendritic spines were identifiable ~100 μm deep into the sample. Reproduced from Ke et al. [58] under the terms of Creative Commons CC-BY-NC-ND license.
Figure 4
Figure 4
sDISCO greatly stabilizes fluorophores and allows for SRM-based studies. sDISCO achieves transparency of the (A) entire mouse brain (B) down to 2 μm that is (C) compatible with SRM imaging. (C) In the overview and detailed image, the thick slice of a Thy1--YFP--H mouse brain was acquired by confocal microscopy using a 40× objective and STED microscopy using a 100× objective, respectively. The scale bars represent 50 μm in the overview image and 5 μm in the inset. (DF) sDISCO greatly stabilizes fluorophores even months after the completion of clearing, and (G) the effect is achievable with a straightforward protocol. Reproduced from Hahn et al. [61] with permission. ** p < 0.01.
Figure 5
Figure 5
Tissue processing with SHIELD stabilizes its architecture and fluorescence. (A) Autofluorescence and (B) YFP images of 1-mm-thick mouse brain blocks confirm (C,D) excellent preservation of fluorescence and tissue size upon SHIELD processing. M-L/D-V length—measurement of mediolateral and dorsoventral lengths of tissue blocks. Reproduced from Park et al. [79] with permission. * p < 0.05.
Figure 6
Figure 6
CUBIC-HistoVIsion approach allows for the efficient immunolabeling of the entire mouse brain. (AD) The entire murine Thy1-YFP-H brain was cleared, stained using CUBIC-HistoVIsion approach and imaged with the voxel size of 8.3 × 8.3 × 9 μm3. The idea that stands behind this pipeline (see the text for details) opens a new way for deep-tissue immunolabeling without the necessity to apply any external forces/apparatus that could potentially lead to sample damage. Images (EG) represent reconstituted sagittal sections at the position indicated in (A). Reproduced from Susaki et al. [103] under the terms of Creative Commons CC BY license.
Figure 7
Figure 7
Whole-brain analysis of presynaptic sites and DANs in Drosophila. (A) MIP view of the subset of nc82 puncta marking presynaptic sites that are associated with DANs (DAN-assoc nc82), color coded by the local puncta density, in an adult Drosophila brain. Scale bar, 100 μm. (Inset, right) MIP view of all nc82 puncta, using identical color coding of local density. Scale bar, 100 μm. (B) Distribution of local densities of (green) DAN-associated nc82 puncta and (orange) nonDAN-associated nc82 puncta in (A). (C) Distribution of distances from DAN-associated nc82 puncta (green) and nonDAN-associated nc82 puncta (orange) to the nearest nc82 punctum of any kind, and nearest-neighbor distances from one DAN-associated nc82 to another (magenta). (D) Volumetric density of DAN-associated nc82 puncta (green bars) and nonDAN-associated nc82 puncta (red bars), and the percentage of nc82 puncta that are DAN associated (green curve), within each of the 33 brain regions of the adult Drosophila brain. (E) MIP view of DANs and DAN-associated nc82 puncta, color coded by 13 representative brain regions. Scale bar, 100 μm. (Insets) Magnified views of the (top, angled view) PB and (bottom) EB. Brain regions are ME, medulla; LOP, lobula plate; LO, lobula; OTU, optical tubercle; VLPR, ventrolateral protocerebrum; LH, lateral horn; CA, calyx; MB, mushroom body; ATL, antler; PB, protocerebral bridge; EB, ellipsoid body; FB, fan-shaped body; NO, noduli; LAL, lateral accessory lobe; and SP, superior protocerebrum. “L” and “R” indicate the left and right hemispheres of the brain, respectively. From Gao et al. [11]. Reprinted with permission from AAAS.

Similar articles

References

    1. Smith D.J. Progress and Perspectives for Atomic-Resolution Electron Microscopy. Ultramicroscopy. 2008;108:159–166. doi: 10.1016/j.ultramic.2007.08.015. - DOI - PubMed
    1. Smith D.J. Ultimate Resolution in the Electron Microscope? Mater. Today. 2008;11:30–38. doi: 10.1016/S1369-7021(09)70005-7. - DOI
    1. Susaki E.A., Tainaka K., Perrin D., Yukinaga H., Kuno A., Ueda H.R. Advanced CUBIC Protocols for Whole-Brain and Whole-Body Clearing and Imaging. Nat. Protoc. 2015;10:1709–1727. doi: 10.1038/nprot.2015.085. - DOI - PubMed
    1. Lu C.-H., Tang W.-C., Liu Y.-T., Chang S.-W., Wu F.C.M., Chen C.-Y., Tsai Y.-C., Yang S.-M., Kuo C.-W., Okada Y., et al. Lightsheet Localization Microscopy Enables Fast, Large-Scale, and Three-Dimensional Super-Resolution Imaging. Commun. Biol. 2019;2:1–10. doi: 10.1038/s42003-019-0403-9. - DOI - PMC - PubMed
    1. Susaki E.A., Ueda H.R. Whole-Body and Whole-Organ Clearing and Imaging Techniques with Single-Cell Resolution: Toward Organism-Level Systems Biology in Mammals. Cell Chem. Biol. 2016;23:137–157. doi: 10.1016/j.chembiol.2015.11.009. - DOI - PubMed