. 2021 Jun 23;13(7):1203.
doi: 10.3390/v13071203.

The Erns Carboxyterminus: Much More Than a Membrane Anchor

Affiliations

The Erns Carboxyterminus: Much More Than a Membrane Anchor

Birke Andrea Tews et al. Viruses. .

Abstract

Pestiviruses express the unique essential envelope protein Erns, which exhibits RNase activity, is attached to membranes by a long amphipathic helix, and is partially secreted from infected cells. The RNase activity of Erns is directly connected with pestivirus virulence. Formation of homodimers and secretion of the protein are hypothesized to be important for its role as a virulence factor, which impairs the host's innate immune response to pestivirus infection. The unusual membrane anchor of Erns raises questions with regard to proteolytic processing of the viral polyprotein at the Erns carboxy-terminus. Moreover, the membrane anchor is crucial for establishing the critical equilibrium between retention and secretion and ensures intracellular accumulation of the protein at the site of virus budding so that it is available to serve both as structural component of the virion and factor controlling host immune reactions. In the present manuscript, we summarize published as well as new data on the molecular features of Erns including aspects of its interplay with the other two envelope proteins with a special focus on the biochemistry of the Erns membrane anchor.

Keywords: ER retention; RNA virus polyprotein processing; amphipathic helix; charge zipper; extracellular vesicles; membrane anchor; pestivirus; secreted T2 RNase; signal peptidase; transport of virus particles; virus assembly; virus budding.


Conflict of interest statement

The authors declare that they have no conflicts of interest.

Figures

Figure 2
Figure 2
Processing of the pestivirus glycoprotein precursor. Schematic representation of the precursor with the three pestiviral glycoproteins in their precleavage topology (further details in [57]). The SP cleavage sites are indicated by black dots. For the Erns/E1 site, the flanking sequences are given below the scheme using the colors of the protein representations. The amino acid sequence is derived from CSFV Alfort/Tübingen.
Figure 1
Figure 1
Features of the Erns membrane anchor. (A) shows the carboxy-terminal sequence of Erns from BVDV CP7. Amino acids in bold are those that were found to have no water accessibility in peptides in bicelles. Colored in red is the sequence that was used for the molecular dynamics simulation leading to the membrane anchor model shown in (B). The simulation was done for Erns residues Arg194 to Ala227 at 72 ns in an explicit DMPC membrane. The protein shows a strong helical fold and lies slightly inclined in the hydrophobic region of the membrane just beneath the lipid head groups (see [16] for further information). Location of N and C terminus are indicated. (C) Percentage of Erns that is membrane associated. Recombinantly expressed Erns mutants that were successively shorted by a single amino acid from the carboxy-terminus (see stars that indicate the different stop sites in (A) were analyzed for their membrane association). Asterisks denote significant differences from the wt protein as tested with one-way ANOVA and a Dunnett’s post-hoc test with three stars representing p ≤ 0.001. Already the loss of four amino acids from the carboxy-terminus leads to a significant loss of membrane association.
Figure 3
Figure 3
Scheme presenting the Erns charge zipper hypothesis. The upper part shows the carboxy-terminal amino acid sequence of Erns (sequence CSFV Alfort/Tübingen). Charged residues are shown in red (negative charge, indicated also by “-“) or blue (positive charge, indicated also by “+”). Cysteine 171, which is responsible for Erns homodimerization, is highlighted with a turquoise background. Above the amino acid sequence, a scale with 10-residue calibration starting with glutamic acid at Position 170 is shown. Below the amino acid sequence, the net charges of the residues are given. The designations of the amino acids mutated in the studies presented here are given with the short forms used especially in the figures and the full number as used in the text: D7 = Asp177, D4 = Asp184, E1 = Glu191, R4 = Arg194, R9 = Arg199, and R6 = Arg206. The bottom part shows a scheme summarizing the charge zipper theory proposed to be involved in processing the Erns-E1 precursor. The charge zipper allows the initial formation of a hairpin structure inserted into the membrane, thereby forming a suitable substrate for SP cleavage. After processing, the Erns carboxy-terminus is proposed to re-orientate and form an amphipathic helix binding in plane to the membrane surface as experimentally determined for the mature protein [16]. The scheme was based on the original presentation of the hypothesis [78] but modified according to recently published data on the role of E1 for the processing step [19].
Figure 4
Figure 4
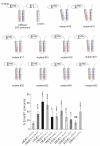
Effect of mutations of the conserved inner six charged residues in the Erns carboxy-terminal helix on Erns-E1 processing. The upper part shows a schematic presentation of the mutants in the putative charge zipper region of Erns. Amino acids are as described above (D7 = Asp177, D4 = Asp184, E1 = Glu191, R4 = Arg194, R9 = Arg199, and R6 = Arg206). Red color symbolizes negative charge (also indicated by “-“), and blue color positive charge (also indicated by “+”). The tilted helices shown for mutants 10 ErE1, 11 ErE1, 17 ErE1, 21 ErE1 and 32 ErE1 indicate the different degree of repulsion induced by the charge changes. The bar diagram summarizes the results of immunoprecipitation experiments after expression of Erns-E1 with the mutations shown above. The numbers of the constructs together with the charge distribution patterns are indicated at the X-axis. The bars represent the percentage of uncleaved Erns-E1 precursor determined in at least three independent experiments. The calculation principle is described in Materials and Methods section. Error bars are indicated and the p-Values for the results determined for the mutants with respect to the wt Erns-E1 are indicated by asterisks. Significant differences of the Erns-E1 processing rate were observed for constructs in 10ErE1 and 11ErE1 (p-Value < 0.0001), 15ErE1 (p-Value = 0.0022), 17ErE1 (p-Value < 0.0001), 18ErE1 (p-Value < 0.0001), 0.21 ErE1 (p-Value < 0.0001), 22ErE1 (p-Value < 0.0001), 23ErE1 (p-Value = 0.0093), and 32ErE1 (p-Value < 0.0001), whereas 30ErE1 gave no significant difference (Ns = not significant). p-Value ranges: * ** = <0.01 and **** < 0.0001.
Figure 5
Figure 5
Erns is statically retained in the ER. BHK-21 cells were transfected with plasmids coding for different GFP tagged variants of Erns, namely Erns of BVDV CP7 (GFP-Erns CP7), Erns of BVDV KE9 (GFP-Erns KE9) and Erns of BVDV CP7, in which the membrane anchor had been replaced by a hydrophobic sequence (GFP-Erns-TM CP7). The transfected cells were used in FRAP experiments. Shown are images directly before the bleaching and at the indicated time intervals after bleaching. The bleached areas are magnified in the insets in the corners.
Figure 6
Figure 6
Schematic drawing of the envelope proteins and p7 before (A) and after (B) processing. Before cleavage the membrane regions of all three proteins start and end in the ER-lumen, with the Erns membrane anchor in the more likely in plane configuration, but slightly tilted, and the other two most probably in a banana-like or hairpin conformation. After cleavage the Erns membrane anchor stays in plane in the membrane while E2 and E1 adopt single span transmembrane conformations [14,57,103].
Figure 7
Figure 7
Charge exchange mutations in the membrane anchor can increase Erns secretion. Results of immunoprecipitation experiments from extracts or supernatants of BHK-21 cells transiently expressing Erns (from construct SErns [19]) or mutants thereof with exchanges affecting the charged residues in the Erns carboxy-terminus. The radioactively labelled proteins were precipitated from the supernatant and cell extract with Erns specific mab 24/16, treated with PNGase F and separated by SDS-PAGE. The diagram summarizes the results of at least three independent experiments quantified via phosphorimager analysis. The number of the individual construct together with the charge distribution in the Erns carboxy-terminus are given at the X-axis. The bars represent the amount of secreted protein as percent of total recovered Erns. For calculation, the counts determined for extra- and intracellular Erns were set to 100% expression product as basis for calculation of the secretion value. Error bars are indicated as well as the p-Value of Erns mutants compared to Erns wt with **** representing p < 0.0001, ** p= 0.002 for 10Er and ns = not significant for 23Er. “-“ indicates a negative, “+” a positive charge.
Figure 8
Figure 8
Effect of a KDEL retrieval signal on the secretion of Erns and a mutant thereof. (A) Representation of the basic features of the constructs used in the experiments. The upper panel shows the constructs based on the wt sequence of Erns whereas the lower panel lists the constructs based on mutant 17Er (see also legend to Figure 3 and [80] for further information on the mutant). On the left the names of the constructs are given whereas on the right the charge distribution in the amphipathic helix and the carboxy-terminal sequences of the encoded Erns proteins specifying the type of the KDEL modification are shown. Changes with regard to the wt sequence are in red. (B) Result of an immunoprecipitation experiment of transiently expressed proteins using Erns-specific monoclonal antibody 24/16 and separation of precipitates by SDS-PAGE. Proteins were precipitated either from supernatant (S) or from equivalent amounts of lysate of the transfected cells (CL). On top of the gels the expressed constructs are specified. Left part: constructs based on the wt construct SErns [19]; right part: constructs based on mutant 17Er. Please note that the secreted proteins exhibit a significantly higher molecular weight due to maturation of carbohydrates in the Golgi apparatus. (C) Diagram summarizing the results of three independent experiments quantified via phosphorimager analysis. The names of the constructs are given at the X-axis. The bars represent the amount of secreted protein as percent of total recovered Erns. The counts determined for extra- and intracellular Erns were set to 100% expression product as basis for calculation of the secretion value. Error bars are indicated as well as the p-Value of Erns mutants compared to Erns wt without KDEL (black lines and asterisks) and of the mutants containing KDEL compared to mutant 17Er without KDEL (red lines and asterisks) with **** representing p < 0.0001, * p = 0.0109, *** p = 0.0002 and ns = not significant.
Figure 9
Figure 9
Pulse/chase analysis of Erns secretion. The diagram summarizes the results of pulse chase studies comparing the secretion of wt Erns (SErns) and the super-secretion mutant SErnsE1:10 over time. The bars represent the amount of secreted protein as percent of total recovered Erns. The counts determined for extra- and intracellular Erns quantified via phosphorimager analysis were set to 100% expression product as basis for calculation of the secretion value. At the X-axis the information on the samples is given with SS standing for steady state (26 h labelling) and for the other samples the time of chase following a 2 h pulse labelling time.
Figure 10
Figure 10
Erns copurifies with extracellular vesicles. (A) Electron microscopic picture of a typical preparation of extracellular vesicles from the supernatant of cells expressing SErnsE1:10. Differences from this picture with regard to number or morphology were not observed when preparations from cells expressing wt Erns or naive cells or pestivirus infected cells were analyzed. (B) Western Blot with samples produced during EV enrichment. Cultures of non-transfected BHK-21 cells infected with Vaccina virus MVA-T7 (mock), and cells expressing Erns wt (SErns) or the super-secretion variant mutant SErnsE1:10 served as starting material. Supernatant of the cultures was subjected to vesicle enrichment via the ExoQuick-TC kit resulting in a vesicle containing pellet fraction (P-EV) and a vesicle-free supernatant (S-EV). For control purposes, lysates of the corresponding cells were analyzed (CL). Antibodies against calnexin (upper panel, marker for cell resident proteins), TSG101 (marker for EVs/exosomes, middle panel) and Erns (lower panel) were used for Western blot. (C) same as in B but with SK6 cells infected with CSFV Alfort/Tübingen or SK6 mock control.
Figure 11
Figure 11
SK6TO_Erns cells stably expressing Erns under control of an inducible promoter secrete Erns in a vesicle bound form. (A) Electron microscopic pictures of vesicles enriched from the supernatant of SK6TO_Erns cells with or without doxycycline induction (lower or upper panel, respectively). Bar represents 100 nm. (B) Western Blot with samples produced during EV enrichment. Cultures of SK6TO_Erns cells minus or plus doxycycline induction served as starting material. Supernatant of the cultures was either loaded without fractionation (total S) or subjected to vesicle enrichment via the ExoQuick-TC kit resulting in vesicle containing pellet fraction (P-EV) and vesicle-free supernatant (S-EV). For control purposes lysates of the corresponding cells were analyzed (CL). Antibodies against Erns were used for Western blot with samples from the different fractions separated via SDS-PAGE. (C) Similar as in (B) but including a TSG101 control showing that treatment with doxycycline for induction of Erns expression has no dramatic effect on EV secretion.
Figure 12
Figure 12
Electron microscopic pictures of immunogold-labelled pestivirus particles and enriched vesicles. CSFV particles enriched from the supernatant of infected SK6 cells by centrifugation (A) or vesicles enriched from supernatant of SK6TO_Erns induced with doxycycline were analyzed by immunogold-labelling using Erns specific mab 24/16 and gold-labelled secondary antibody. In (B) vesicles with gold grains are highlighted with red arrows. Bars represent 50 nm.
Figure 13
Figure 13
Exchange of charged residues in the Erns membrane anchor can block production of infectious virus. Immunofluorescence analyses conducted after transfection of CSFV genome-like wt RNA or RNA with the given selected exchanges of one triplet coding for a charged amino acid in the carboxy-terminal region of Erns. The upper row shows results of analyses conducted ca. 24 h post electroporation and proves that all tested RNAs represent functional replicons. The lower row shows the results obtained after three passages of cell culture supernatant used for infection of fresh cells. Immunofluorescence was done with mab a18 directed against the E2 protein [33]. “-“ represents a negative, “+” a positive charge. Magnification 100×.
Figure 14
Figure 14
Determination of viral RNA levels in cells and cell culture supernatant. (A) Schematic presentation of the method used for propagation of mutant viruses. Step 1: SK6_TO cells were transfected via electroporation and Erns production (by the cells) was induced with doxycycline. Viral particles were recovered from wt or defective mutant RNAs due to the trans complementation with wt Erns. Step 2: The recovered infectious viruses were used in single cycle experiments for infection. Viral RNA was harvested from cells and supernatant and then used for quantification of viral RNA displaying the wt sequence or an Erns deletion mutant or mutants with deleterious exchanges. Viral RNA in the supernatant should result from secretion of viral particles shown here as gray dots. (B) Results of viral RNA quantification via qRT-PCR in lysates (left) or equivalent amounts of supernatant of SK6 cells infected with wt CSFV or stocks of mutants propagated in complementing SK6TO_Erns cells. Infection was done with an MOI of one. Harvest for total RNA isolation was done separately for cells and supernatant at 4h or 48 h p.i. and the viral genome copy number was determined via real time RT-PCR. The bar diagrams summarize the results of three independent experiments showing the mean log10 values of the viral genome copy numbers with standard deviation indicated.

Similar articles

Cited by

References

    1. Lindenbach B.D., Thiel H.J., Rice C.M. Flaviviridae: The Viruses and Their Replication. In: Knipe D.M., Howley P.M., editors. Fields Virology. Volume 5. Lippincott—Raven Publishers; Philadelphia, PA, USA: 2007. pp. 1101–1152.
    1. Tautz N., Tews B.A., Meyers G. The Molecular Biology of Pestiviruses. Adv. Virus Res. 2015;93:47–160. doi: 10.1016/bs.aivir.2015.03.002. - DOI - PubMed
    1. Wang Z., Nie Y., Wang P., Ding M., Deng H. Characterization of classical swine fever virus entry by using pseudotyped viruses: E1 and E2 are sufficient to mediate viral entry. Virology. 2004;330:332–341. doi: 10.1016/j.virol.2004.09.023. - DOI - PubMed
    1. Ronecker S., Zimmer G., Herrler G., Greiser-Wilke I., Grummer B. Formation of bovine viral diarrhea virus E1–E2 heterodimers is essential for virus entry and depends on charged residues in the transmembrane domains. J. Gen. Virol. 2008;89:2114–2121. doi: 10.1099/vir.0.2008/001792-0. - DOI - PubMed
    1. Meyer C., Von Freyburg M., Elbers K., Meyers G. Recovery of virulent and RNase-negative attenuated type 2 bovine viral diarrhea viruses from infectious cDNA clones. J. Virol. 2002;76:8494–8503. doi: 10.1128/JVI.76.16.8494-8503.2002. - DOI - PMC - PubMed

Publication types

MeSH terms

LinkOut - more resources