. 2021 Jun 23;22(13):6752.
doi: 10.3390/ijms22136752.

Metabolic Dynamics in Short- and Long-Term Microgravity in Human Primary Macrophages

Affiliations

Metabolic Dynamics in Short- and Long-Term Microgravity in Human Primary Macrophages

Cora S Thiel et al. Int J Mol Sci. .

Abstract

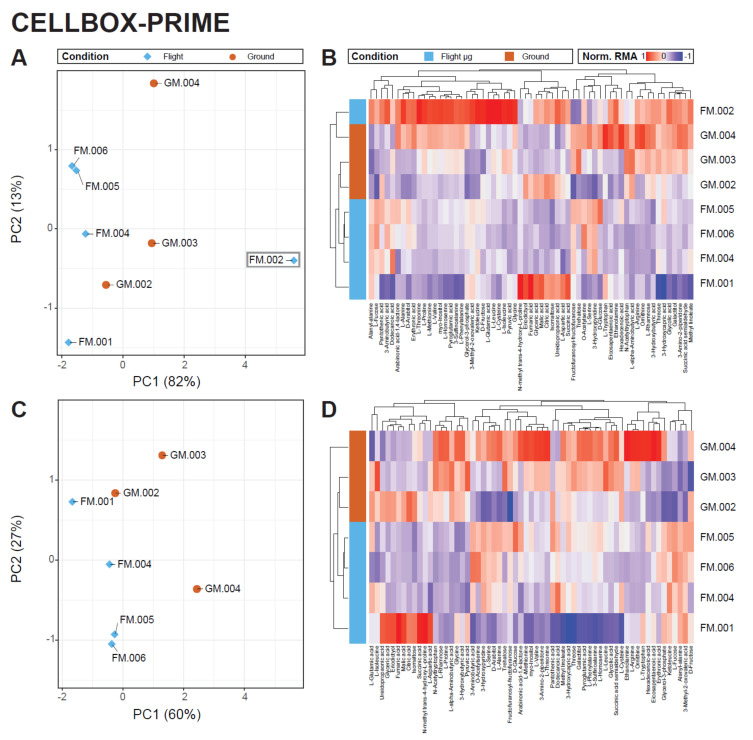
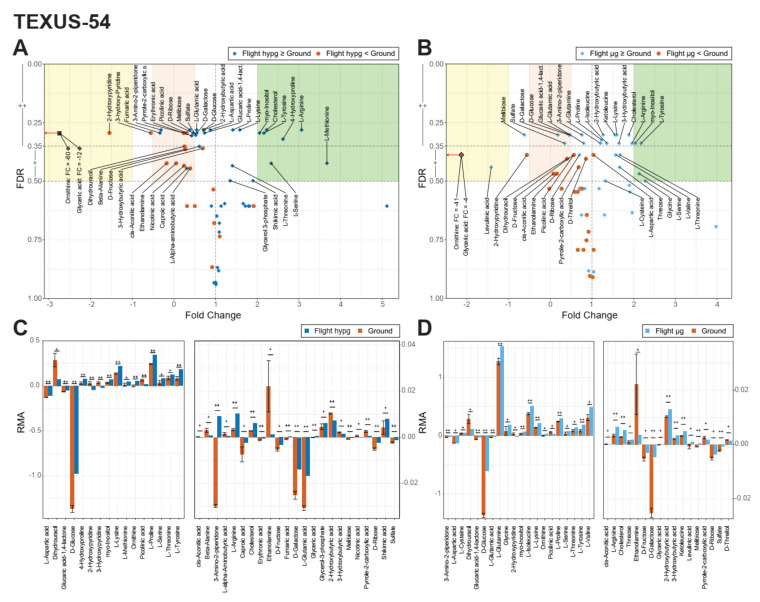
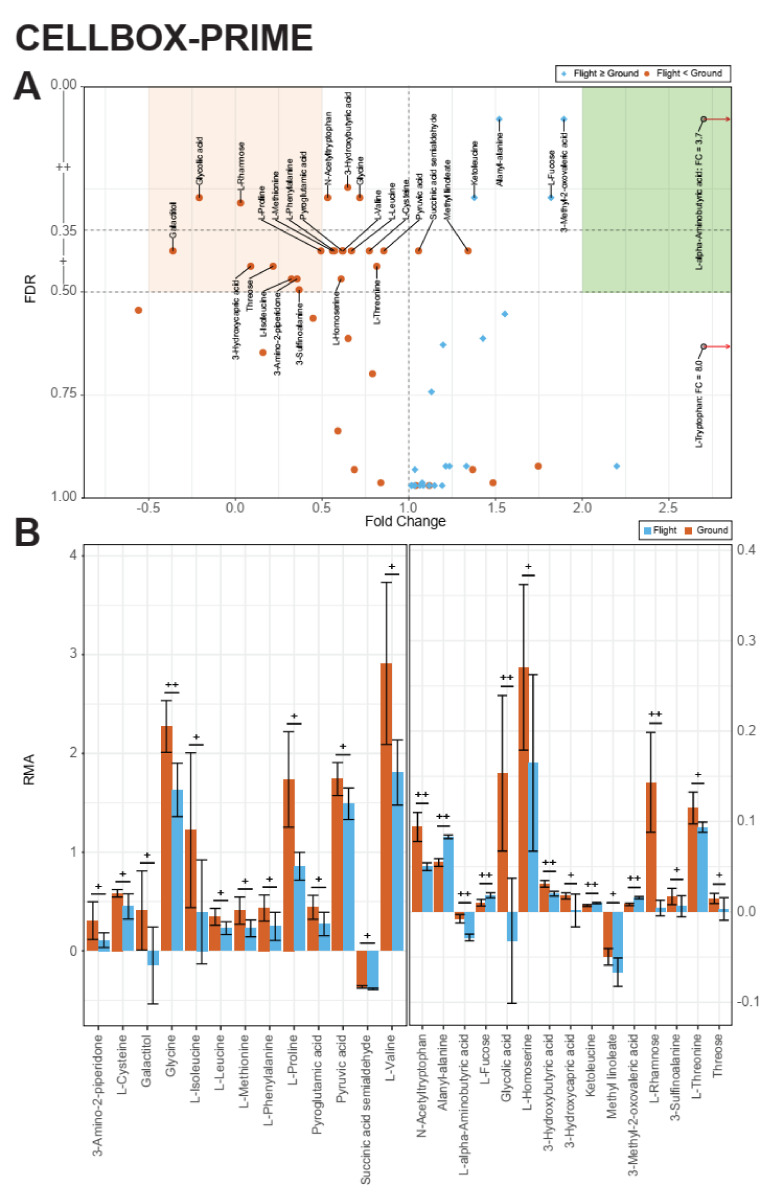
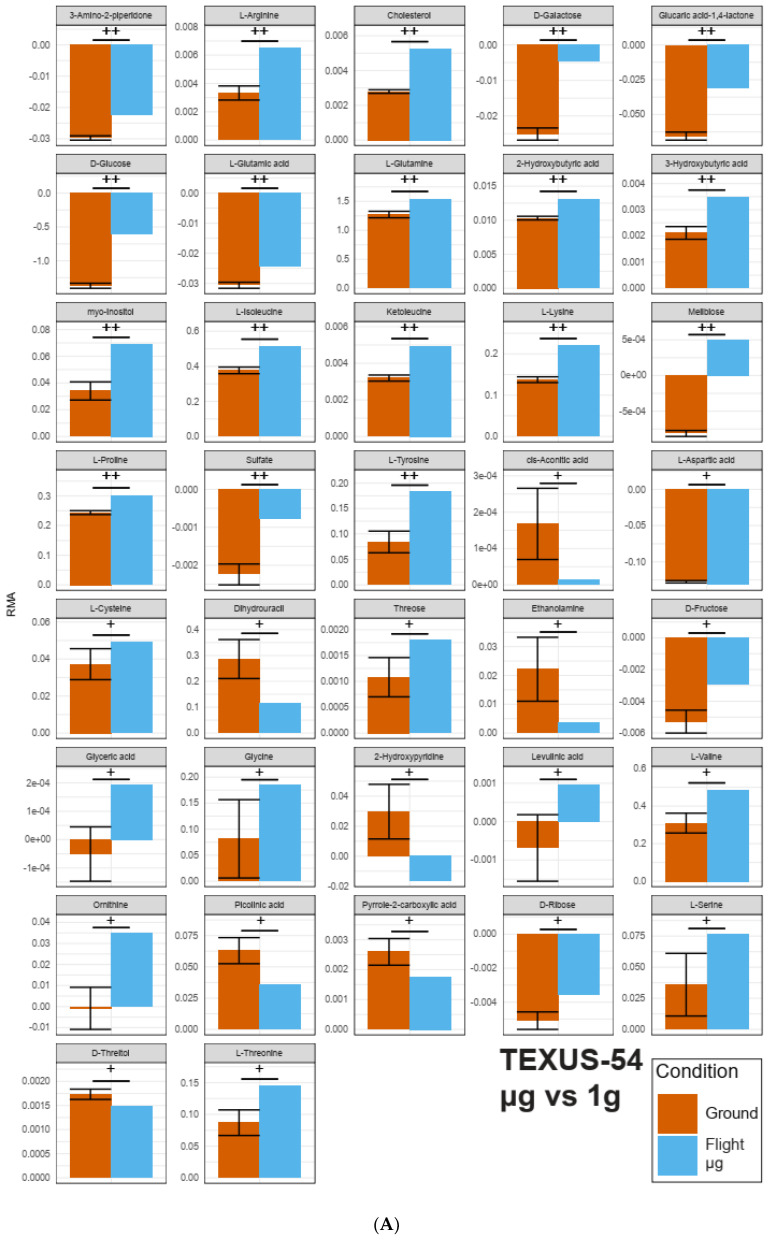
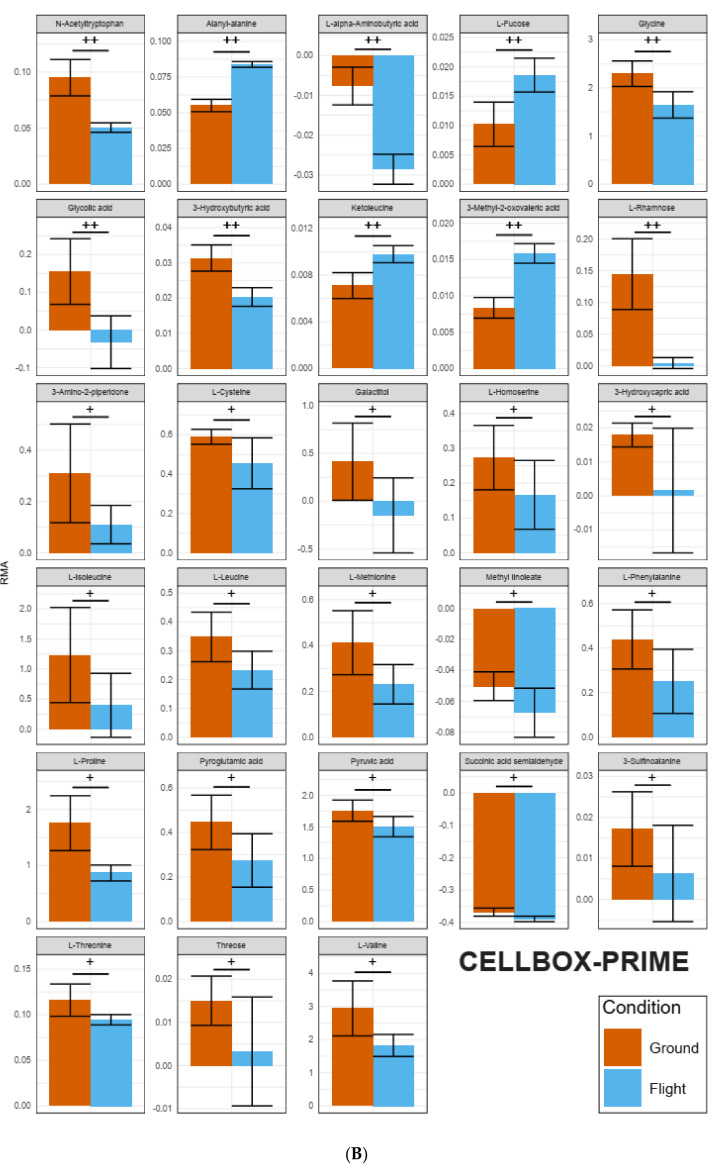
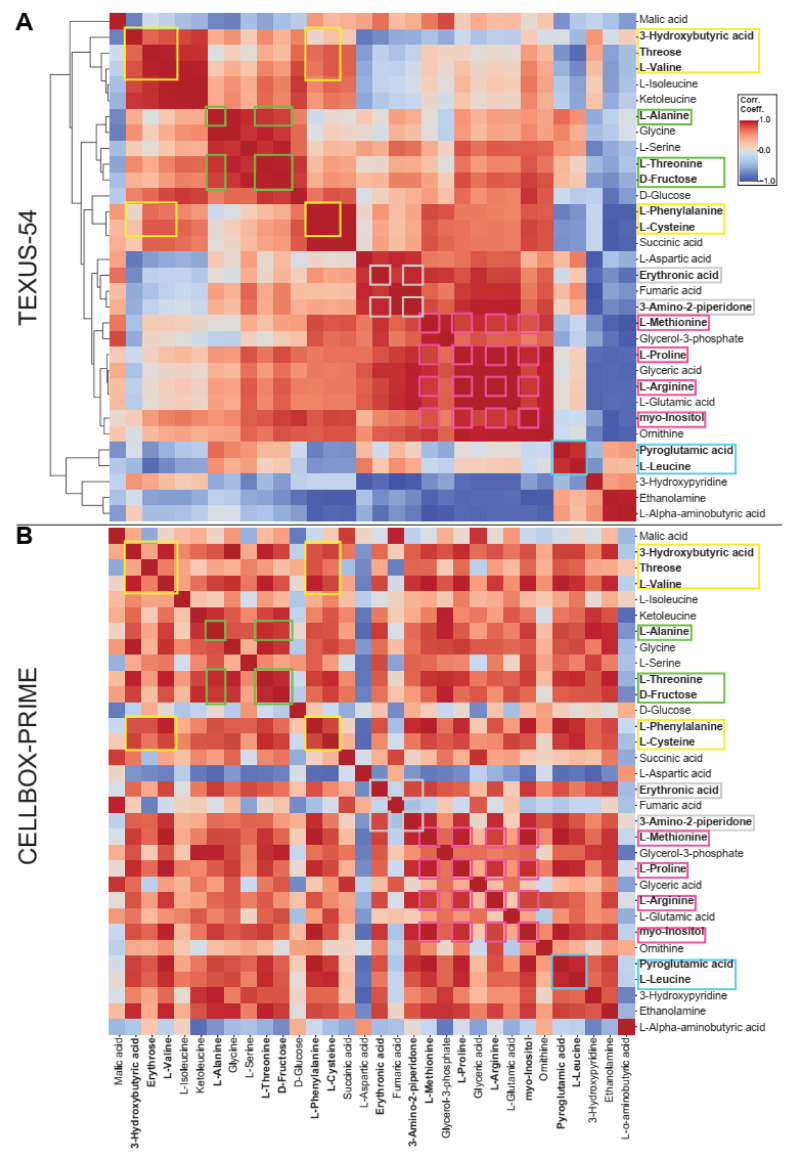
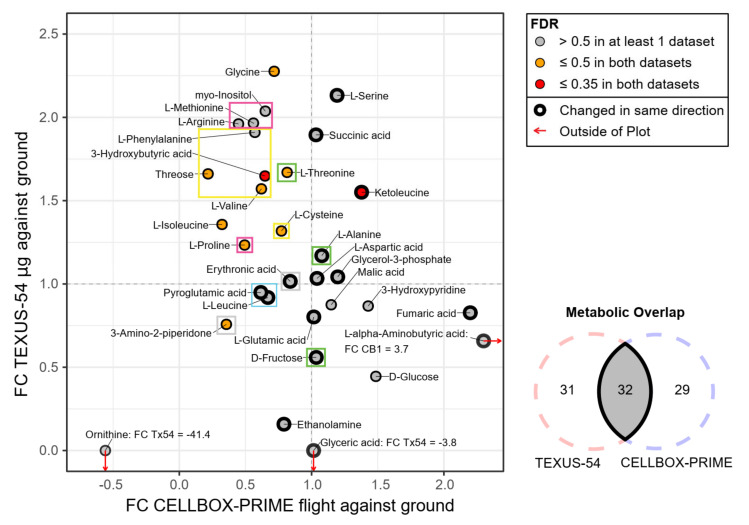
Microgravity acts on cellular systems on several levels. Cells of the immune system especially react rapidly to changes in gravity. In this study, we performed a correlative metabolomics analysis on short-term and long-term microgravity effects on primary human macrophages. We could detect an increased amino acid concentration after five minutes of altered gravity, that was inverted after 11 days of microgravity. The amino acids that reacted the most to changes in gravity were tightly clustered. The observed effects indicated protein degradation processes in microgravity. Further, glucogenic and ketogenic amino acids were further degraded to Glucose and Ketoleucine. The latter is robustly accumulated in short-term and long-term microgravity but not in hypergravity. We detected highly dynamic and also robust adaptative metabolic changes in altered gravity. Metabolomic studies could contribute significantly to the understanding of gravity-induced integrative effects in human cells.

Keywords: immune cells; metabolomics; microgravity; sounding rocket; spaceflight.


Conflict of interest statement

The authors declare no conflict of interest.

Figures

Figure 1
Figure 1
The experimental setups and fixation mechanisms of the TEXUS-54 FLUFIX hardware and the CELLBOX-PRIME hardware. (A) The layout of the FLUFIX hardware. Primary macrophages are stored inside two parallel cultivation chambers. Fixation solution is stored in a spring-loaded tank that injects its content into the two cultivation chambers upon valve release. Hereby, the cultivation chamber supernatant is flushed into the fixative container back chamber and thereby replaced by fixative. Metabolomics samples are gathered from the fixative container back chamber. Adapted from [17]. (B) The layout of the CELLBOX-PRIME hardware. The cell cultivation chamber is connected to two tanks, a fixative and a stabilizer container. First, the fixative is flushed into the cultivation chamber by the pump, thereby (partly) displacing the cell supernatant into the fixative tank back chamber. After fixation, the stabilizer is flushed into the cultivation chamber by the pump, partly displacing the cultivation chamber supernatant into the stabilizer container back chamber. Chambers that are highlighted in grey are used as metabolomics samples. (C) Human M1 Macrophages were used for both studies, displayed through a microscope. (DH) TEXUS-54 hardware (D) Preparation of the slide containing the adherent macrophages. (E) Insertion of the bottom slide into the cultivation chamber. (F) Insertion of the top slide into the cultivation chamber. (G) Casing of the cultivation chamber. (H) Final assembly of the hardware unit. (IL) CELLBOX-PRIME hardware, adapted from [17]. (I) Technical blueprint of the flight hardware with the two tanks and the pump at the bottom, casing, experimental chamber, and cover on top. (J) Tanks and hardware. (K) Experimental slide, compartmented into subslides. L Filled slides, carrying macrophages in media.
Figure 2
Figure 2
Experimental fixation scheme of the two campaigns. (A) The macrophages were separated and integrated into the TEXUS-54 hardware 5.5 h prior to launch. The rocket was launched at 10:30. After 50 s, the first hypergravity (hypg) sample was fixed. Then, 375 s after launch, the microgravity (µg) sample was fixed. Two ground controls that were integrated into the hardware but not launched were taken at the corresponding timepoints of the different fixation times. (B) The CELLBOX-PRIME hardware was uplifted to the ISS. After 11 days in microgravity, cells were fixed and stabilized, thereby stopping biological activity. After another 19 days, samples were recovered and prepared for analysis. Corresponding ground controls that were integrated into the same hardware and that were exposed to the same temperature profile as the flight samples were fixed at the same dates.
Figure 3
Figure 3
Workflow schematics of the data analysis. Corresponding figures from this paper are indicated in yellow circles. Samples that were analyzed by Gas Chromatography - Mass Spectrometry (GC-MS) and were peak-called, standardized and-post processed per experiment, were analyzed as abundance values. Metabolite spectra that could not be matched with a well-characterized reference metabolite were therefore called unknown metabolites and were filtered out from the datasets. Consecutively, metabolites with a large number of missing values/non-present metabolites per dataset were excluded, and metabolites with a small number of missing values underwent missing value imputation. Biological media blanks were subtracted. Further, problematic metabolites that were impurities from the equipment, used for fixation or with no biological information yield, were discarded. An unsupervised analysis (Figure 4 and Figure 5), based on heatmaps and principal component analysis, was performed and potential outlier samples removed. Consecutively, metabolites that were significantly differentially abundant in different experimental groups were identified per experiment (Figure 6, Figure 7 and Figure 8). Metabolites that were present in both datasets were compared in terms of fold change and direction of regulation (Figure 9). Independently, intra-dataset metabolite abundance values were correlated against each other to be able to detect potential regulatory associations (Figure 10).
Figure 4
Figure 4
Unsupervised analysis of samples from TEXUS-54. (A) Principal component analysis (PCA) plot of the four samples of the mission. The dominant principal component 1 separated ground from flight samples, though the variation along the ground samples was dominant. (B) A clustering heatmap plot of the same samples. Normalized relative metabolic abundance (Norm. RMA) is displayed for every metabolite (horizontal axis) for every sample (vertical axis). Cluster grids are proportional to relative differences along samples/groups. Ground and flight samples cluster together which speaks in favor of an effect-driven separation, though the differences within groups are rather large. (C) A PCA plot where the two ground samples were merged into a shared ground sample to visualize the average effect of ground samples are combined into one sample group. A clear separation of flight effects can be identified, in which the microgravity sample displays a stronger separation than the hypg sample, which is in line with the microgravity sample being exposed to altered gravity for a longer period of time. (D) The clustering heatmap displaying the dataset where the two ground controls were combined.
Figure 5
Figure 5
Unsupervised analysis of samples from CELLBOX-PRIME. (A) PCA plot of all 5 flight datapoints (in blue) and all 3 ground datapoints (in brown). Principal component 1 represents 82% of total variance in the dataset. Flight samples all localize left of ground samples, except for FM.002. (B) Clustering heatmap of the same data. FM.002 does not cluster with any sample from the flight set and has the highest normalized RMA for almost all quantifiable metabolites. Based on A and B and the appearance of the sample chamber indicating potential tightness issues, FM.002 was considered a statistical outlier sample and excluded from further analysis. (C) PCA of all samples, excluding FM.002. A distinct clustering of flight and of ground samples along PC1 can be observed. (D) Clustering heatmap of the dataset, excluding FM.002. GM.004 and FM.001 are separated from the rest of the samples but do not show RMA value distributions that do not compare to other samples as extremely as FM.002 does.
Figure 6
Figure 6
Volcano and bar plots of samples from TEXUS-54. (A,B) Volcano plots showing the estimated false discovery rate (FDR) against fold change (FC) for the (A) comparisons flight hypg/ground and (B) flight µg/ground. Because some metabolites showed negative abundance values relative to medium blanks, FC can be negative. The direction of change is indicated by color and shape of the point. As an orientation aid, areas of significant large effect increase (double or more) are highlighted by a light green frame, areas of significant effect decrease (half or less, and inverted if below 0) are highlighted in red, and areas of significant effect inversion (consumption of metabolite to production or production to consumption) with equal or increased effect strength are highlighted in light yellow. (A) 41% of all metabolites showed an FDR below 0.35, 63% below 0.5. Ornithine, and glyceric acid showed exceptionally low FCs of −60, and −12, respectively, which exceed the plot margins and are therefore set to smaller values with the correct fold change indicated in their labels. (B) 29% of all metabolites showed an FDR below 0.35, 60% below 0.5. Also, Ornithine and Glyceric acid showed exceptionally low FCs of −41, and −4, respectively. (C,D): Bar plots showing relative metabolite abundance (RMA) for flight hypg (C) and flight µg (D) and the ground samples for metabolites with an FDR ≤ 0.5. Ground samples are pooled from two biological samples. Error bars represent mean ± standard deviation. +: FDR ≤ 0.5; ++: FDR ≤ 0.35. The plots are split into two subplots with two different linear axes to be able to display all metabolites on linear scales despite their RMA distribution over several orders of magnitude.
Figure 7
Figure 7
Volcano and bar plots of samples from CELLBOX-PRIME. As an orientation help, areas of significant effect decrease (half or less) are highlighted in red. (A) Volcano plot showing the estimated false discover rate (FDR) against fold change (FC) for the comparison flight/ground. The direction of change is indicated by the color and shape of the point. As an orientation aid, areas of significant large effect increase (double or more) are highlighted by a light green frame, and areas of significant effect decrease (half or less, and inverted if below 0) are highlighted in red. It is revealed that 15% of all metabolites showed an FDR below 0.35, 43% below 0.5. L-alpha-Aminobutyric acid and L-Tryptophan both have fold changes that exceed the plot margins, therefore they were set to a fold change of 2.7, and the correct fold change was included in their label. (B) Bar plot showing mean ± standard deviation of relative metabolite abundance (RMA) from three ground samples and four flight samples. Only metabolites with FDR ≤ 0.5 are shown. +: FDR ≤ 0.5; ++: FDR ≤ 0.35. The plots are split into two subplots with two different linear axes to be able to display all metabolites on linear scales despite their RMA distribution over several orders of magnitude.
Figure 8
Figure 8
(A). Faceted bar plots for TEXUS-54 µg vs. ground control. Only metabolites with FDR ≤ 0.5 are shown. Each metabolite is shown with an individual relative metabolite abundance (RMA) scale. Ground samples are pooled from two biological samples, mean ± standard deviation is shown. +: FDR ≤ 0.5; ++: FDR ≤ 0.35. (B). Faceted bar plots for CELLBOX-PRIME. Only metabolites with FDR ≤ 0.5 are shown. Each metabolite is shown with an individual relative metabolite abundance (RMA) scale. Samples are pooled from three (ground) and four (flight) samples, respectively. Mean ± standard deviation is shown. +: FDR ≤ 0.5; ++: FDR ≤ 0.35.
Figure 8
Figure 8
(A). Faceted bar plots for TEXUS-54 µg vs. ground control. Only metabolites with FDR ≤ 0.5 are shown. Each metabolite is shown with an individual relative metabolite abundance (RMA) scale. Ground samples are pooled from two biological samples, mean ± standard deviation is shown. +: FDR ≤ 0.5; ++: FDR ≤ 0.35. (B). Faceted bar plots for CELLBOX-PRIME. Only metabolites with FDR ≤ 0.5 are shown. Each metabolite is shown with an individual relative metabolite abundance (RMA) scale. Samples are pooled from three (ground) and four (flight) samples, respectively. Mean ± standard deviation is shown. +: FDR ≤ 0.5; ++: FDR ≤ 0.35.
Figure 9
Figure 9
Clustered correlation plot between metabolites for each experiment. Based on the per-sample abundance values, the Pearson correlation coefficients between each metabolite was calculated per experiment. Metabolites that correlate strongly with each other in both experiments are considered a cluster and highlighted with colored frames, one color per group. Clusters are an indicator for metabolic pathways; if elements of clusters are significantly altered, a profound altered gravity effect is indicated. (A) Clustered correlation plot for TEXUS-54. Metabolites are ordered by the clustering of their correlation coefficients, which is visualized on the left side of the plot. (B) Correlation coefficients for CELLBOX-PRIME. For maximum comparability, the metabolites are in the same order as for A, therefore a mixed pattern emerges that does not follow the clustering for metabolites in CELLBOX-PRIME. A large cluster is present in both experiments centered around Threose and L-Valine and around L-Phenylalanine and L-Cysteine.
Figure 10
Figure 10
Inter-experiment correlation diagram, plotting the fold changes of shared metabolites. Each dot represents 1 out of 32 shared metabolites. Metabolites that show a difference in the same direction (decrease or increase of RMA value for both sets) are highlighted by a stronger black border. Metabolites that have FDRs lower than certain thresholds are highlighted in yellow or red (comp. legend). Ornithine, Glyceric acid, and L-alpha-Aminobutyric acid all have fold changes that exceed the plot margins; they were set to a fold change of 0 for TEXUS-54, resp. 2.3 for L-alpha-Aminobutyric acid for CELLBOX-PRIME, the correct fold change was included in their label. Clusters that were identified in Figure 9 have been included in the figure by drawing colored boxes around metabolites that are in a cluster group. The plot has four different quadrants, with many metabolites in the top left quadrant with increased concentrations for TEXUS-54 and decreased concentrations for CELLBOX-PRIME, and a center that includes metabolites which do not or only slightly react to altered gravity.

Similar articles

Cited by

References

    1. Kimzey S.L. Biomedical Results from Skylab. NASA; Washington, DC, USA: 1977. Hematology and immunology studies.
    1. Cogoli A., Tschopp A., Fuchs-Bislin P. Cell sensitivity to gravity. Science. 1984;225:228–230. doi: 10.1126/science.6729481. - DOI - PubMed
    1. Cogoli-Greuter M., Meloni M.A., Sciola L., Spano A., Pippia P., Monaco G., Cogoli A. Movements and interactions of leukocytes in microgravity. J. Biotechnol. 1996;47:279–287. doi: 10.1016/0168-1656(96)01380-6. - DOI - PubMed
    1. NASA Manned Spacecraft Center . Gemini Summary Conference. NASA; Houston, TX, USA: 1967.
    1. Konstantinova I.V., Antropova Y.N., Legenkov V.I., Zazhirey V.D. Study of reactivity of blood lymphoid cells in crew members of the Soyuz-6, Soyuz-7 and Soyuz-8 spaceships before and after flight(blatogenesis delay of lymphocytes) Space Biol. Med. 1973;7:48–55.

LinkOut - more resources