Proteogenomics Reveals Orthologous Alternatively Spliced Proteoforms in the Same Human and Mouse Brain Regions with Differential Abundance in an Alzheimer's Disease Mouse Model
- PMID: 34201730
- PMCID: PMC8303486
- DOI: 10.3390/cells10071583
Proteogenomics Reveals Orthologous Alternatively Spliced Proteoforms in the Same Human and Mouse Brain Regions with Differential Abundance in an Alzheimer's Disease Mouse Model
Abstract
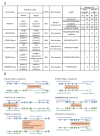
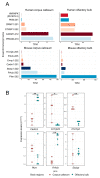
Alternative splicing (AS) may increase the number of proteoforms produced by a gene. Alzheimer's disease (AD) is a neurodegenerative disease with well-characterized AS proteoforms. In this study, we used a proteogenomics strategy to build a customized protein sequence database and identify orthologous AS proteoforms between humans and mice on publicly available shotgun proteomics (MS/MS) data of the corpus callosum (CC) and olfactory bulb (OB). Identical proteotypic peptides of six orthologous AS proteoforms were found in both species: PKM1 (gene PKM/Pkm), STXBP1a (gene STXBP1/Stxbp1), Isoform 3 (gene HNRNPK/Hnrnpk), LCRMP-1 (gene CRMP1/Crmp1), SP3 (gene CADM1/Cadm1), and PKCβII (gene PRKCB/Prkcb). These AS variants were also detected at the transcript level by publicly available RNA-Seq data and experimentally validated by RT-qPCR. Additionally, PKM1 and STXBP1a were detected at higher abundances in a publicly available MS/MS dataset of the AD mouse model APP/PS1 than its wild type. These data corroborate other reports, which suggest that PKM1 and STXBP1a AS proteoforms might play a role in amyloid-like aggregate formation. To the best of our knowledge, this report is the first to describe PKM1 and STXBP1a overexpression in the OB of an AD mouse model. We hope that our strategy may be of use in future human neurodegenerative studies using mouse models.
Keywords: Alzheimer’s disease; mRNA splicing; neurodegeneration; proteogenomics.
Conflict of interest statement
The authors declare no conflict of interest. The funders had no role in the design of the study; in the collection, analyses, or interpretation of data; in the writing of the manuscript; or in the decision to publish the results.
Figures


Similar articles
-
Deep proteomic network analysis of Alzheimer's disease brain reveals alterations in RNA binding proteins and RNA splicing associated with disease.Mol Neurodegener. 2018 Oct 4;13(1):52. doi: 10.1186/s13024-018-0282-4. Mol Neurodegener. 2018. PMID: 30286791 Free PMC article.
-
An early dysregulation of FAK and MEK/ERK signaling pathways precedes the β-amyloid deposition in the olfactory bulb of APP/PS1 mouse model of Alzheimer's disease.J Proteomics. 2016 Oct 4;148:149-58. doi: 10.1016/j.jprot.2016.07.032. Epub 2016 Aug 3. J Proteomics. 2016. PMID: 27498392
-
Levels and alternative splicing of amyloid beta protein precursor (APP) transcripts in brains of APP transgenic mice and humans with Alzheimer's disease.J Biol Chem. 1995 Nov 24;270(47):28257-67. doi: 10.1074/jbc.270.47.28257. J Biol Chem. 1995. PMID: 7499323
-
The Challenge to Search for New Nervous System Disease Biomarker Candidates: the Opportunity to Use the Proteogenomics Approach.J Mol Neurosci. 2019 Jan;67(1):150-164. doi: 10.1007/s12031-018-1220-1. Epub 2018 Dec 15. J Mol Neurosci. 2019. PMID: 30554402 Review.
-
False discovery rate: the Achilles' heel of proteogenomics.Brief Bioinform. 2022 Sep 20;23(5):bbac163. doi: 10.1093/bib/bbac163. Brief Bioinform. 2022. PMID: 35534181 Review.
Cited by
-
Exploring novel blood-based DNA methylation biomarkers for alzheimer's disease via targeted sequencing of highly variable CpG sites.BMC Res Notes. 2025 Aug 12;18(1):350. doi: 10.1186/s13104-025-07417-7. BMC Res Notes. 2025. PMID: 40796861 Free PMC article.
-
SpliceProt 2.0: A Sequence Repository of Human, Mouse, and Rat Proteoforms.Int J Mol Sci. 2024 Jan 18;25(2):1183. doi: 10.3390/ijms25021183. Int J Mol Sci. 2024. PMID: 38256255 Free PMC article.
-
ROCK Inhibitor Fasudil Attenuates Neuroinflammation and Associated Metabolic Dysregulation in the Tau Transgenic Mouse Model of Alzheimer's Disease.Curr Alzheimer Res. 2024;21(3):183-200. doi: 10.2174/0115672050317608240531130204. Curr Alzheimer Res. 2024. PMID: 38910422 Free PMC article.
-
Identification of Novel Genes and Proteoforms in Angiostrongylus costaricensis through a Proteogenomic Approach.Pathogens. 2022 Oct 31;11(11):1273. doi: 10.3390/pathogens11111273. Pathogens. 2022. PMID: 36365024 Free PMC article.
References
-
- Pathan M., Samuel M., Keerthikumar S., Mathivanan S. Proteome Bioinformatics. Volume 1549. Springer Nature; Cham, Switzerland: 2017. Unassigned MS/MS Spectra: Who Am I? pp. 67–74.
Publication types
MeSH terms
Substances
Grants and funding
- Finance Code 001/Coordenação de Aperfeiçoamento de Pessoal de Nível Superior
- E-26/202.658/2018/Fundação Carlos Chagas Filho de Amparo à Pesquisa do Estado do Rio de Janeiro
- 301707/2017-0/Conselho Nacional de Desenvolvimento Científico e Tecnológico
- 308697/2019-7/Conselho Nacional de Desenvolvimento Científico e Tecnológico
- 442421/2019-2/Conselho Nacional de Desenvolvimento Científico e Tecnológico
LinkOut - more resources
Full Text Sources
Medical
Research Materials
Miscellaneous

