

Plasma Metabolomics for Discovery of Early Metabolic Markers of Prostate Cancer Based on Ultra-High-Performance Liquid Chromatography-High Resolution Mass Spectrometry
- PMID: 34201735
- PMCID: PMC8268247
- DOI: 10.3390/cancers13133140
Plasma Metabolomics for Discovery of Early Metabolic Markers of Prostate Cancer Based on Ultra-High-Performance Liquid Chromatography-High Resolution Mass Spectrometry
Abstract
Background: The prevention and early screening of PCa is highly dependent on the identification of new biomarkers. In this study, we investigated whether plasma metabolic profiles from healthy males provide novel early biomarkers associated with future risk of PCa.
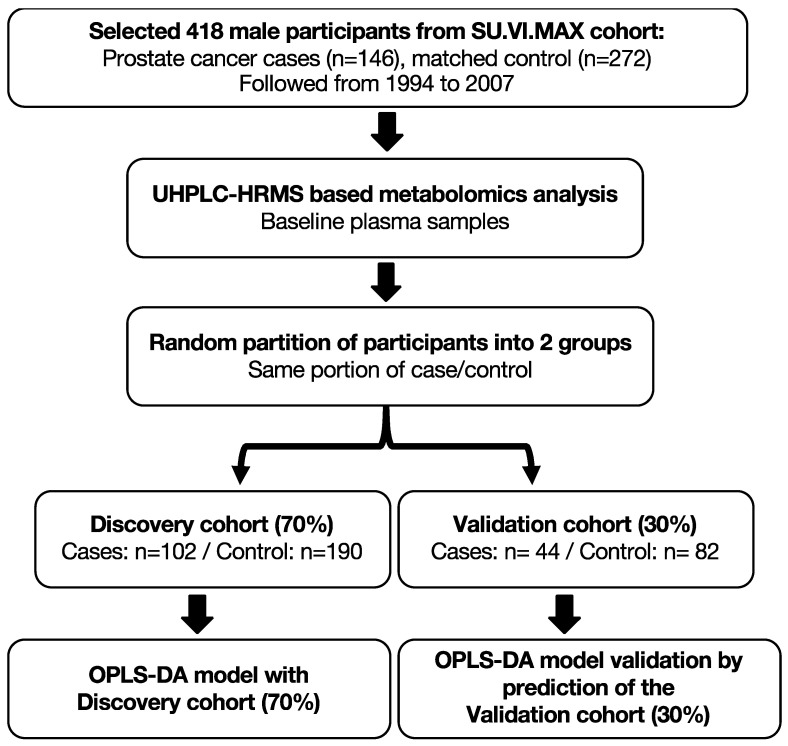
Methods: Using the Supplémentation en Vitamines et Minéraux Antioxydants (SU.VI.MAX) cohort, we identified plasma samples collected from 146 PCa cases up to 13 years prior to diagnosis and 272 matched controls. Plasma metabolic profiles were characterized using ultra-high-performance liquid chromatography-high resolution mass spectrometry (UHPLC-HRMS).
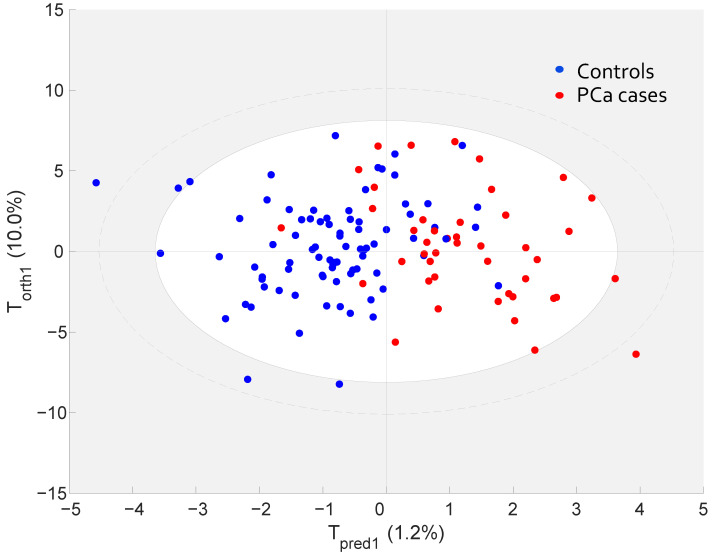
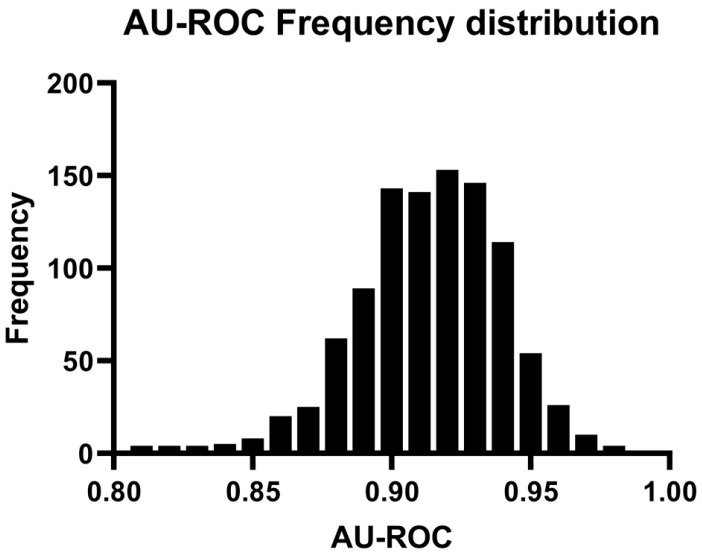
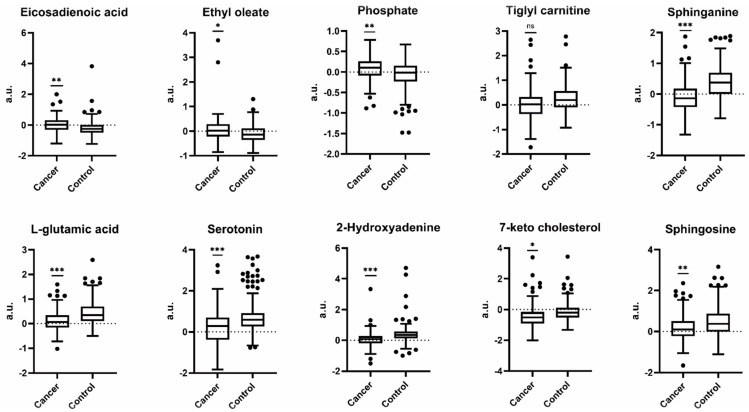
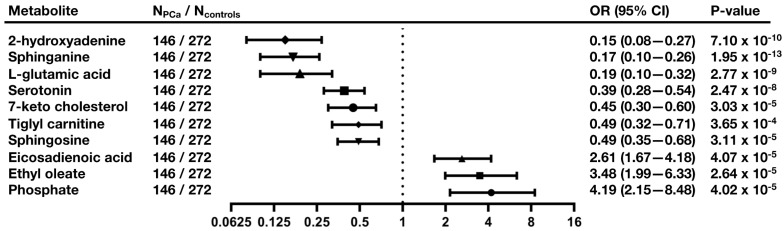
Results: Orthogonal partial least squares discriminant analysis (OPLS-DA) discriminated PCa cases from controls, with a median area under the receiver operating characteristic curve (AU-ROC) of 0.92 using a 1000-time repeated random sub-sampling validation. Sparse Partial Least Squares Discriminant Analysis (sPLS-DA) identified the top 10 most important metabolites (p < 0.001) discriminating PCa cases from controls. Among them, phosphate, ethyl oleate, eicosadienoic acid were higher in individuals that developed PCa than in the controls during the follow-up. In contrast, 2-hydroxyadenine, sphinganine, L-glutamic acid, serotonin, 7-keto cholesterol, tiglyl carnitine, and sphingosine were lower.
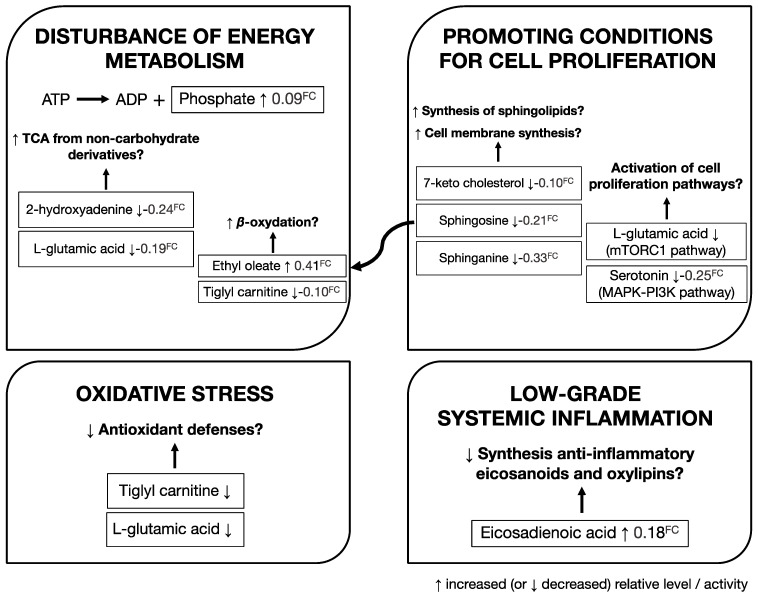
Conclusion: Our results support the dysregulation of amino acids and sphingolipid metabolism during the development of PCa. After validation in an independent cohort, these signatures may promote the development of new prevention and screening strategies to identify males at future risk of PCa.
Keywords: LC-MS; biomarkers; metabolomics; multivariate analysis; prostate cancer.
Conflict of interest statement
The authors declare no potential conflict of interest.
Figures
Similar articles
-
Metabolomics Profiling Discriminates Prostate Cancer From Benign Prostatic Hyperplasia Within the Prostate-Specific Antigen Gray Zone.Front Oncol. 2021 Oct 15;11:730638. doi: 10.3389/fonc.2021.730638. eCollection 2021. Front Oncol. 2021. PMID: 34722271 Free PMC article.
-
Identification of the metabolic signatures of prostate cancer by mass spectrometry-based plasma and urine metabolomics analysis.Prostate. 2021 Dec;81(16):1320-1328. doi: 10.1002/pros.24229. Epub 2021 Sep 30. Prostate. 2021. PMID: 34590739
-
Human Melanoma-Cell Metabolic Profiling: Identification of Novel Biomarkers Indicating Metastasis.Int J Mol Sci. 2020 Mar 31;21(7):2436. doi: 10.3390/ijms21072436. Int J Mol Sci. 2020. PMID: 32244549 Free PMC article.
-
Metabolomics of papillary thyroid carcinoma tissues: potential biomarkers for diagnosis and promising targets for therapy.Tumour Biol. 2016 Aug;37(8):11163-75. doi: 10.1007/s13277-016-4996-z. Epub 2016 Mar 2. Tumour Biol. 2016. PMID: 26935059
-
Screening of synthetic PDE-5 inhibitors and their analogues as adulterants: analytical techniques and challenges.J Pharm Biomed Anal. 2014 Jan;87:176-90. doi: 10.1016/j.jpba.2013.04.037. Epub 2013 May 6. J Pharm Biomed Anal. 2014. PMID: 23721687 Review.
Cited by
-
DPP3 promotes breast cancer tumorigenesis by stabilizing FASN and promoting lipid synthesis.Acta Biochim Biophys Sin (Shanghai). 2024 May 25;56(5):805-818. doi: 10.3724/abbs.2024054. Acta Biochim Biophys Sin (Shanghai). 2024. PMID: 38655619 Free PMC article.
-
Advances in Prostate Cancer Biomarkers and Probes.Cyborg Bionic Syst. 2024 Jun 27;5:0129. doi: 10.34133/cbsystems.0129. eCollection 2024. Cyborg Bionic Syst. 2024. PMID: 40353136 Free PMC article. Review.
-
Integrating anamnestic and lifestyle data with sphingolipid levels for risk-based prostate cancer screening.J Transl Med. 2025 Jul 14;23(1):790. doi: 10.1186/s12967-025-06820-9. J Transl Med. 2025. PMID: 40660231 Free PMC article.
-
Deep learning-based metabolomics data study of prostate cancer.BMC Bioinformatics. 2024 Dec 26;25(1):391. doi: 10.1186/s12859-024-06016-w. BMC Bioinformatics. 2024. PMID: 39725937 Free PMC article.
-
Prostate cancer risk biomarkers from large cohort and prospective metabolomics studies: A systematic review.Transl Oncol. 2025 Jan;51:102196. doi: 10.1016/j.tranon.2024.102196. Epub 2024 Nov 23. Transl Oncol. 2025. PMID: 39580963 Free PMC article. Review.
References
-
- Nicholson A., Mahon J., Boland A., Beale S., Dwan K., Fleeman N., Hockenhull J., Dundar Y. The Clinical Effectiveness and Cost-Effectiveness of the PROGENSA® Prostate Cancer Antigen 3 Assay and the Prostate Health Index in the Diagnosis of Prostate Cancer: A Systematic Review and Economic Evaluation. Health Technol. Assess. 2015;19:i–xxxi, 1–191. doi: 10.3310/hta19870. - DOI - PMC - PubMed
-
- Draisma G., Boer R., Otto S.J., van der Cruijsen I.W., Damhuis R.A.M., Schröder F.H., de Koning H.J. Lead Times and Overdetection due to Prostate-Specific Antigen Screening: Estimates from the European Randomized Study of Screening for Prostate Cancer. J. Natl. Cancer Inst. 2003;95:868–878. doi: 10.1093/jnci/95.12.868. - DOI - PubMed
LinkOut - more resources
Full Text Sources
Research Materials
