. 2021 Jun 23;13(7):936.
doi: 10.3390/pharmaceutics13070936.

In Vitro Metabolism of Donepezil in Liver Microsomes Using Non-Targeted Metabolomics

Affiliations

In Vitro Metabolism of Donepezil in Liver Microsomes Using Non-Targeted Metabolomics

Sin-Eun Kim et al. Pharmaceutics. .

Abstract

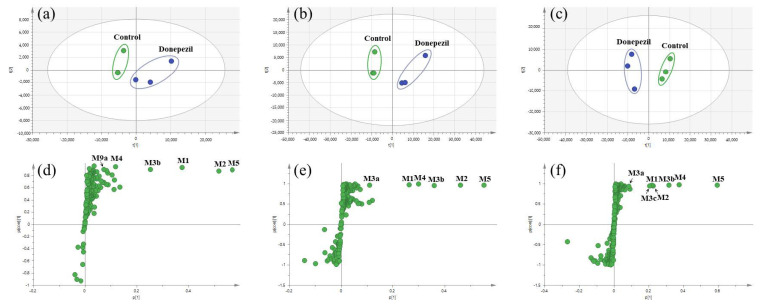
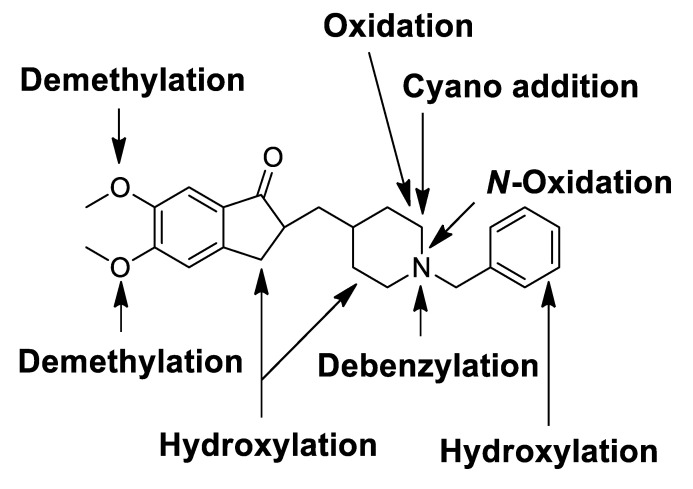
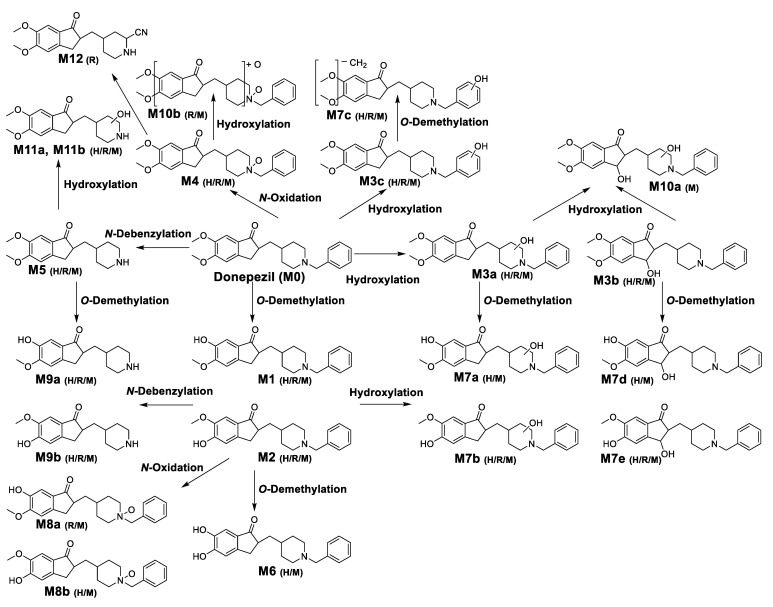
Donepezil is a reversible acetylcholinesterase inhibitor that is currently the most commonly prescribed drug for the treatment of Alzheimer's disease. In general, donepezil is known as a safe and well-tolerated drug, and it was not associated with liver abnormalities in several clinical trials. However, rare cases of drug-related liver toxicity have been reported since it has become commercially available. Few studies have investigated the metabolic profile of donepezil, and the mechanism of liver damage caused by donepezil has not been elucidated. In this study, the in vitro metabolism of donepezil was investigated using liquid chromatography-tandem mass spectrometry based on a non-targeted metabolomics approach. To identify metabolites, the data were subjected to multivariate data analysis and molecular networking. A total of 21 donepezil metabolites (17 in human liver microsomes, 21 in mice liver microsomes, and 17 in rat liver microsomes) were detected including 14 newly identified metabolites. One potential reactive metabolite was identified in rat liver microsomal incubation samples. Metabolites were formed through four major metabolic pathways: (1) O-demethylation, (2) hydroxylation, (3) N-oxidation, and (4) N-debenzylation. This study indicates that a non-targeted metabolomics approach combined with molecular networking is a reliable tool to identify and detect unknown drug metabolites.

Keywords: donepezil; metabolism; metabolomics; molecular networking; multivariate analysis.


Conflict of interest statement

The authors declare no conflict of interest.

Figures

Figure 1
Figure 1
Chemical structures of donepezil and its commercially available metabolites.
Figure 2
Figure 2
Multivariate analysis of donepezil metabolites in human liver microsomes (HLM) (a), mouse liver microsomes (MLM) (b), and rat liver microsomes (RLM) (c). Control groups were incubated in the absence of nicotineamide adenine dinucleotide phosphate reduced form (NADPH), and donepezil groups were incubated in the presence of NADPH. Score plots were generated by a principal component analysis based on the liquid chromatography–high resolution mass spectrometry data of human liver microsomes (HLM) (a), mouse liver microsomes (MLM) (b), and rat liver microsomes (RLM) (c). Loading S−plots were generated by an orthogonal partial least square−discriminant analysis (OPLS−DA) based on the liquid chromatography–high resolution mass spectrometry data of HLM (d), MLM (e), and RLM (f). The p [1] values represent the relevant abundance of ions, and p(corr) [1] values represent the interclass difference. Green dots on the S−plot represent variables (mass spectral data) which reflect the influence of each variable in the two groups (control vs. donepezil). Variables that are farthest from the origin in the S−plot are selected as potential donepezil metabolites. Identified metabolites were marked with abbreviations on the S−plot, and metabolite lists are given in Table 1. Data processing and model construction are described in the Materials and Methods.
Figure 3
Figure 3
Representative molecular network of the MS/MS spectra obtained by the liquid chromatography–high resolution mass spectrometry analysis of the liver microsomal incubation mixtures of donepezil in the presence of nicotineamide adenine dinucleotide phosphate reduced form. Unlabeled blue circles are variables that are networked with donepezil but were confirmed not to be metabolites of donepezil based on MS/MS spectral analysis.
Figure 4
Figure 4
(a) Representative extracted ion chromatograms of donepezil and its metabolites obtained from the liquid chromatography–high resolution mass spectrometry analysis of human liver microsomes (HLM) incubation mixtures of donepezil in the presence of nicotineamide adenine dinucleotide phosphate reduced form (1 h, 37 °C). NL stands for normalization level, which describes the intensity of the highest peak in each chromatogram. (b) Representative extracted ion chromatograms of donepezil and its metabolites obtained from the liquid chromatography–high resolution mass spectrometry analysis of mouse liver microsomes (MLM) incubation mixtures of donepezil in the presence of nicotineamide adenine dinucleotide phosphate reduced form (1 h, 37 °C). NL stands for normalization level, which describes the intensity of the highest peak in each chromatogram. (c) Representative extracted ion chromatograms of donepezil and its metabolites obtained from the liquid chromatography–high resolution mass spectrometry analysis of rat liver microsomes (RLM) incubation mixtures of donepezil in the presence of nicotineamide adenine dinucleotide phosphate reduced form (1 h, 37 °C). NL stands for normalization level, which describes the intensity of the highest peak in each chromatogram.
Figure 4
Figure 4
(a) Representative extracted ion chromatograms of donepezil and its metabolites obtained from the liquid chromatography–high resolution mass spectrometry analysis of human liver microsomes (HLM) incubation mixtures of donepezil in the presence of nicotineamide adenine dinucleotide phosphate reduced form (1 h, 37 °C). NL stands for normalization level, which describes the intensity of the highest peak in each chromatogram. (b) Representative extracted ion chromatograms of donepezil and its metabolites obtained from the liquid chromatography–high resolution mass spectrometry analysis of mouse liver microsomes (MLM) incubation mixtures of donepezil in the presence of nicotineamide adenine dinucleotide phosphate reduced form (1 h, 37 °C). NL stands for normalization level, which describes the intensity of the highest peak in each chromatogram. (c) Representative extracted ion chromatograms of donepezil and its metabolites obtained from the liquid chromatography–high resolution mass spectrometry analysis of rat liver microsomes (RLM) incubation mixtures of donepezil in the presence of nicotineamide adenine dinucleotide phosphate reduced form (1 h, 37 °C). NL stands for normalization level, which describes the intensity of the highest peak in each chromatogram.
Figure 5
Figure 5
Representative extracted ion chromatograms (a), product ion scan mass spectrum and proposed fragmentation scheme (b) of reactive metabolites produced from the incubation of donepezil with rat liver microsomes in the presence of nicotineamide adenine dinucleotide phosphate reduced form and potassium cyanide (1 h, 37 °C).
Figure 6
Figure 6
Proposed bioactivation mechanism of the piperidine ring of donepezil and the formation of a cyano adduct.
Figure 7
Figure 7
Chemical structure of donepezil showing locations of Phase I metabolic reactions and the bioactivation pathway.
Figure 8
Figure 8
Proposed metabolic pathways of donepezil in human liver microsomes (H), rat liver microsomes (R), and mice liver microsomes (M).As a result of comparing metabolites between species, donepezil had similar metabolic profiles in HLM, MLM, and RLM. N-Desbenzydonepezil (M5) was the most abundant metabolite in all incubations. Meier-Davis et al., (2012) also reported N-desbenzydonepezil as the most abundant metabolite in rat and human plasma following oral administration [37] and in rat plasma, liver, and kidney after a single oral administration of donepezil [25]. The metabolite M5 was further metabolized through O-demethylation (M9) or hydroxylation (M11). The second most abundant metabolite was O-desmethyldonepezil (M1 and M2) following HLM and MLM incubation, which was further metabolized by hydroxylation to form additional related metabolites (M7aM7e) compared with RLM. In contrast, donepezil N-oxide (M4) was a much more abundant metabolite in MLM and RLM incubations compared with that of HLM. In addition, dihydroxydonepezil (M10) was characteristically observed only in MLM and RLM incubations.

Similar articles

Cited by

References

    1. Benedetti M.S., Whomsley R., Poggesi I., Cawello W., Mathy F.-X., Delporte M.-L., Papeleu P., Watelet J.-B. Drug metabolism and pharmacokinetics. Drug Metab. Rev. 2009;41:344–390. doi: 10.1080/10837450902891295. - DOI - PubMed
    1. Almazroo O.A., Miah M.K., Venkataramanan R. Drug Metabolism in the Liver. Clin. Liver Dis. 2017;21:1–20. doi: 10.1016/j.cld.2016.08.001. - DOI - PubMed
    1. Zhang Z., Tang W. Drug metabolism in drug discovery and development. Acta Pharm. Sin. B. 2018;8:721–732. doi: 10.1016/j.apsb.2018.04.003. - DOI - PMC - PubMed
    1. He C., Wan H. Drug metabolism and metabolite safety assessment in drug discovery and development. Expert Opin. Drug Metab. Toxicol. 2018;14:1071–1085. doi: 10.1080/17425255.2018.1519546. - DOI - PubMed
    1. Baillie T.A., Rettie A.E. Role of Biotransformation in Drug-Induced Toxicity: Influence of Intra- and Inter-Species Differences in Drug Metabolism. Drug Metab. Pharmacokinet. 2011;26:15–29. doi: 10.2133/dmpk.DMPK-10-RV-089. - DOI - PMC - PubMed

LinkOut - more resources