. 2021 Jun 23;22(13):6760.
doi: 10.3390/ijms22136760.

The C-Terminal Domain of LRRK2 with the G2019S Substitution Increases Mutant A53T α-Synuclein Toxicity in Dopaminergic Neurons In Vivo

Affiliations

The C-Terminal Domain of LRRK2 with the G2019S Substitution Increases Mutant A53T α-Synuclein Toxicity in Dopaminergic Neurons In Vivo

Noémie Cresto et al. Int J Mol Sci. .

Abstract

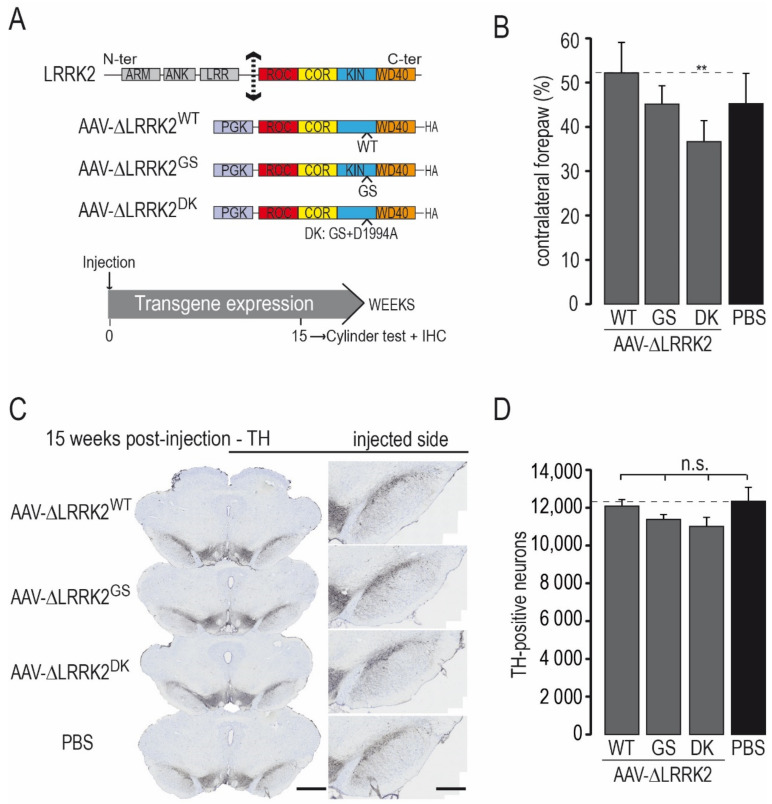
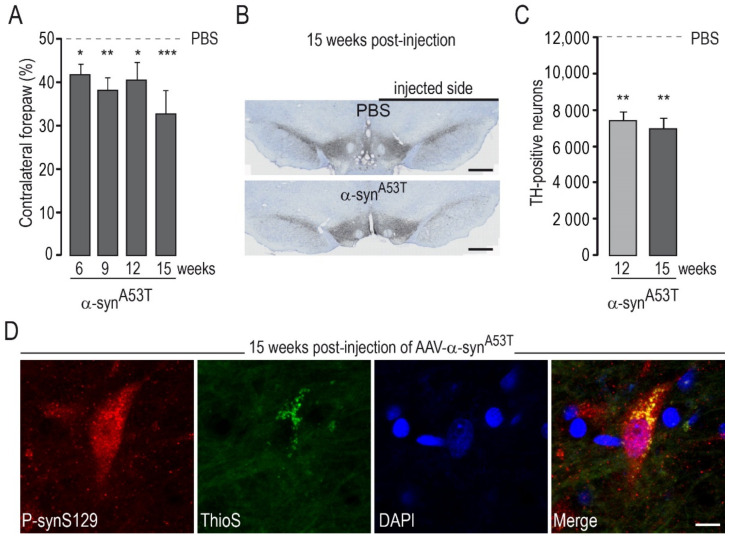
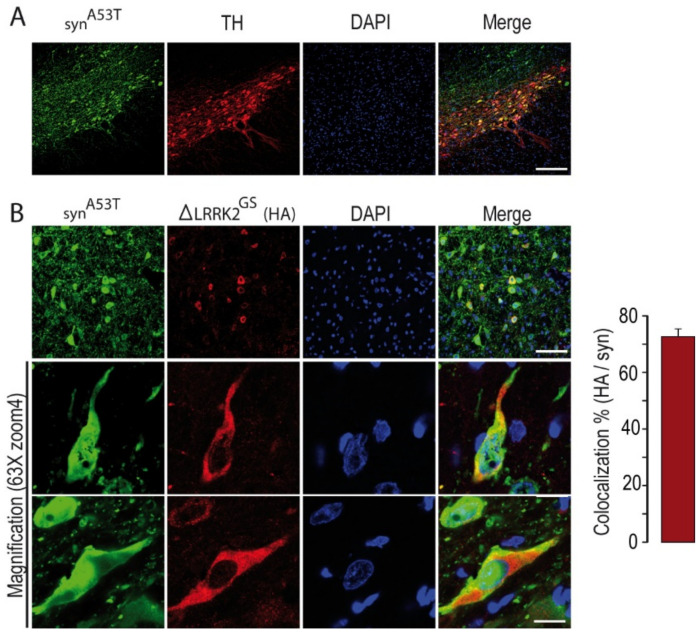
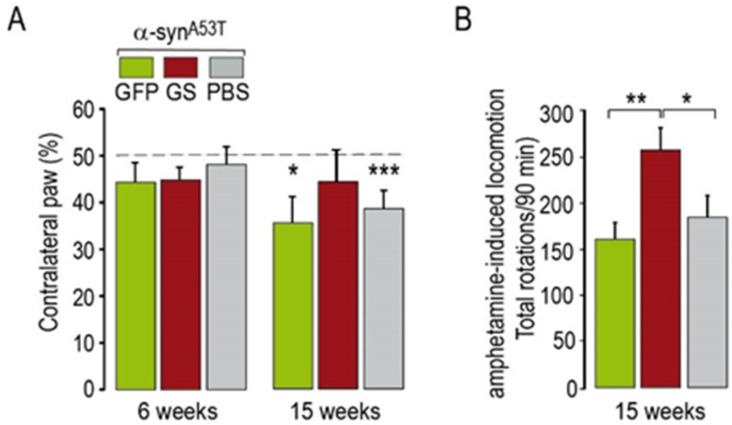
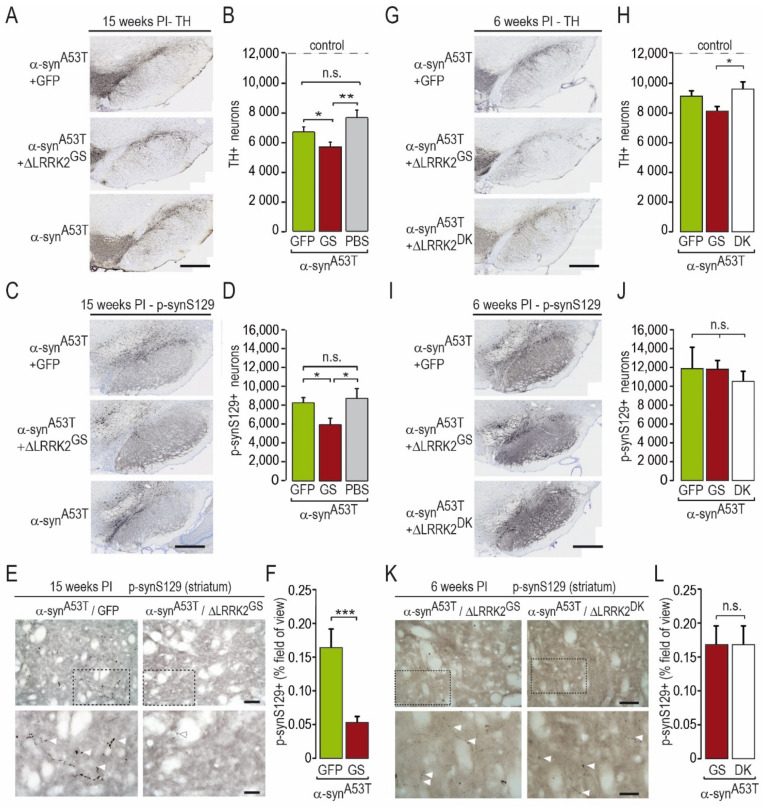
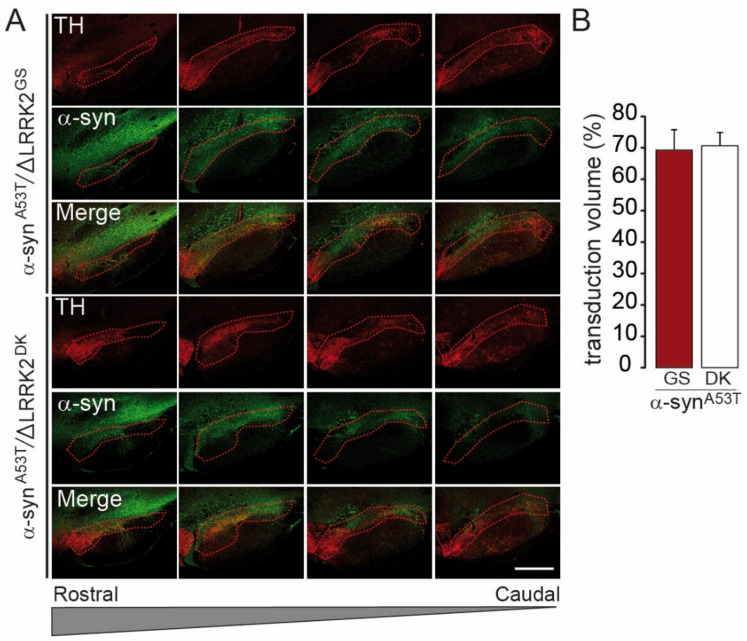
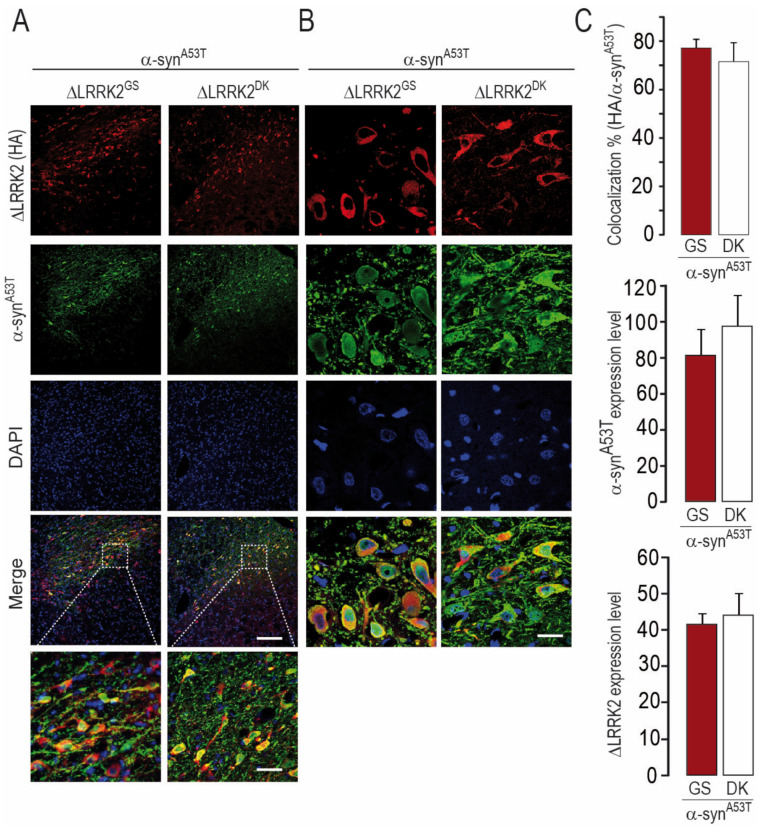
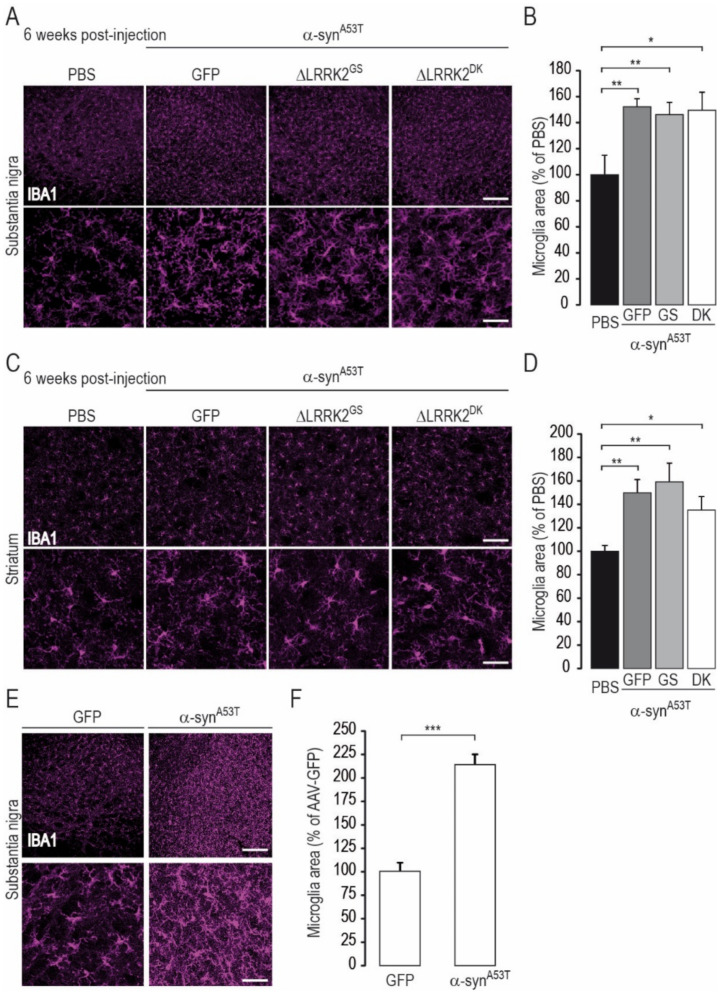
Alpha-synuclein (α-syn) and leucine-rich repeat kinase 2 (LRRK2) play crucial roles in Parkinson's disease (PD). They may functionally interact to induce the degeneration of dopaminergic (DA) neurons via mechanisms that are not yet fully understood. We previously showed that the C-terminal portion of LRRK2 (ΔLRRK2) with the G2019S mutation (ΔLRRK2G2019S) was sufficient to induce neurodegeneration of DA neurons in vivo, suggesting that mutated LRRK2 induces neurotoxicity through mechanisms that are (i) independent of the N-terminal domains and (ii) "cell-autonomous". Here, we explored whether ΔLRRK2G2019S could modify α-syn toxicity through these two mechanisms. We used a co-transduction approach in rats with AAV vectors encoding ΔLRRK2G2019S or its "dead" kinase form, ΔLRRK2DK, and human α-syn with the A53T mutation (AAV-α-synA53T). Behavioral and histological evaluations were performed at 6- and 15-weeks post-injection. Results showed that neither form of ΔLRRK2 alone induced the degeneration of neurons at these post-injection time points. By contrast, injection of AAV-α-synA53T alone resulted in motor signs and degeneration of DA neurons. Co-injection of AAV-α-synA53T with AAV-ΔLRRK2G2019S induced DA neuron degeneration that was significantly higher than that induced by AAV-α-synA53T alone or with AAV-ΔLRRK2DK. Thus, mutated α-syn neurotoxicity can be enhanced by the C-terminal domain of LRRK2G2019 alone, through cell-autonomous mechanisms.

Keywords: AAVs; Parkinson’s disease; cell-autonomous mechanisms; leucine-rich repeat kinase 2; α-synuclein.


Conflict of interest statement

The authors declare no conflict of interest.

Figures

Figure 1
Figure 1
Effects produced by intra-nigral injection of AAVs coding for various forms of the C-terminal fragment of LRRK2. (A) Various forms of the C-terminal fragment of LRRK2 (∆LRRK2) were cloned into an AAV backbone with the PGK promoter: the wild-type form (WT), the pathological form with the G2019S S substitution (GS), or the dead kinase form of G2019 with the D1994A mutation (DK). AAVs were unilaterally injected into the rat SNpc. The cylinder test, which assesses forepaw asymmetry use, was performed at 15 weeks post-injection (PI), and the rats were processed for histological evaluation (ICH). (B) Results of the cylinder test at 15 weeks PI. (C) Representative photomicrographs of sections of the various experimental groups labeled using Tyrosine Hydroxylase (TH) immunohistochemistry. (D) Number of TH-positive neurons in the SNpc measured using unbiased stereology. Results are expressed as the means ± the SEM. N = 8–12 animals/group. ANOVA and PLSD post hoc test. n.s.: not significant. ** p < 0.01. Scale bars: 750 µm left panel and 400 µm right panel in (C).
Figure 2
Figure 2
Degeneration and motor symptoms produced by intra-nigral injection of AAVs encoding α-synA53T. AAV-α-synA53T (2.5 × 10¹⁰ Vg) or vehicle (PBS) were unilaterally injected into the rat SNpc. The cylinder test, which assesses asymmetry of forepaw use, was performed at various timepoints (6–15 weeks) post-injection (PI). Two subgroups of rats were processed for histological evaluation (ICH) at 12 and 15 weeks PI. (A) Results of the cylinder test at various time points after AAV injection. (B) Representative photomicrographs of the SNc in rats injected with AAV-α-synA53T or vehicle (PBS) labeled by Tyrosine Hydroxylase (TH) immunohistochemistry. (C) Number of TH-positive neurons in the SNpc measured using unbiased stereology showing a consistent decrease in the number of TH-positive neurons. (D) Representative confocal images obtained by double immunofluorescence analysis in the SNpc of rats injected with AAV-α-synA53T at 15 weeks PI: neurons with α-syn phosphorylated at serine 129 (p-synS129) (in red). The neuron with high levels p-synS19 immunoreactivity is also positive for ThioS (in green), suggesting that p-synS129 accumulation corresponds, at least partially, to aggregated forms of α-syn. Results are expressed as the means ± the SEM. N = 8–12 animals/group. ANOVA and PLSD post hoc test. * p < 0.05, ** p < 0.01, and *** p < 0.001. Scale bars: B, 750 µm; D, 10 µm.
Figure 3
Figure 3
Histological evaluation of the expression of the transgenes in the SNpc at 15 weeks post-injection. (A) Evaluation of α-syn (in green) transduction in the SNpc after co-injection of AAV-α-synA53T with ΔLRRK2G2019S (ΔLRRK2GS) as determined by delineation of SNpcs with TH staining (red). Scale bar: 500 µm. (B) Measurement of the number of neurons expressing both α-synA53T and ΔLRRK2GS from confocal images. The higher magnification shows cytoplasm localization of ΔLRRK2G2019S.
Figure 4
Figure 4
Motor tests in rats co-injected with AAV-α-synA53T and AAV-GFP or AAV-α-synA53T and AAV-ΔLRRK2G2019S (ΔLRRK2GS). (A) Rats were tested using the cylinder test at 6 and 15 weeks PI to detect asymmetry in forepaw use. (B) Rats were injected with methamphetamine (2.5 mg/kg) to induce hyper-locomotion. Results are expressed as the means ± SEM. N = 8–12 animals/group. ANOVA and PLSD post hoc test. * p < 0.05, ** p < 0.01, *** p < 0.001.
Figure 5
Figure 5
Immunohistochemistry for tyrosine hydroxylase (TH) and p-synS129-positive (p-synS129) cells and axons at 15 and 6 weeks post-injection. (AC) Histological images and graphical quantification of TH-positive cells in the SNpc at 15 weeks PI (A,B) and 6 weeks PI (G,H). (EH) Histological images and graphical quantification of p-synS129-positive (p-synS129+) neurons in the SNpc at 15 weeks PI (C,D) and 6 weeks PI (I,J). The number of TH-positive and p-synS129-positive cells was evaluated using unbiased stereology at very high magnification. (IL) Histological images and graphical quantification of rat brain sections labeled by p-synS129 immunohistochemistry at the level of the striatum at 15 weeks PI (E,F) and 6 weeks PI (K,L) showing the presence of sparse positive objects with a necklace-like organization. The quantification was determined as the percentage of the field of view (area) occupied by p-synS129-positive staining. Results are expressed as the means ± SEM. N = 7–13 animals/group. ANOVA and PLSD post hoc test. * p < 0.05, ** p < 0.01, *** p < 0.001. Scale bars: 400 in (A,C,E,G) and 50 µm in images in (I,K).
Figure 6
Figure 6
Tyrosine hydroxylase (TH) levels in the striatum of rats injected with AAV-α-synA53T with AAV-GFP or ΔLRRK2G2019S in the right SNpc. (A) Photomicrographs at low magnification showing immunofluorescence for TH (red) and GFP (green) in the striatum at 15 weeks PI. Scale bar: 1000 µm. (B) Photomicrographs at two different magnifications (5× and 63×) showing TH-related immunofluorescence in the striatum of rats injected with PBS or AAV-α-synA53T with AAV-GFP, as a control, or ΔLRRK2G2019S (GS). Scale bar in B: 5×, 1000 µm, 63×, 100 µm. (C) Quantification of fluorescence in the striatum. Quantification was performed at 5× magnification. Results are expressed as the means ± SEM. N = 10 animals/group. ANOVA and PLSD post hoc test. ** p < 0.01.
Figure 7
Figure 7
Measurement of the SNpc volume transduced by AAV-ΔLRRK2G2019S and the dead kinase form ΔLRRK2G2019S/D1994A. (A) Confocal images to delineate the SNpc based on TH staining (in red), reported in the green channel, corresponding to the α-syn immunofluorescence when co-expressed with ΔLRRK2G2019S (ΔLRRK2GS) or ΔLRRK2DK, the dead kinase form ΔLRRK2G2019S/D1994A. Scale bar: 1000 µm. (B) Quantification of the fraction (%) of the SNpc expressing α-syn protein after co-transduction with ΔLRRK2G2019S or ΔLRRK2G2019S/D1994A. Results are expressed as the means ± SEM. N = 8 animals/group. No statistical difference, Student’s t-test.
Figure 8
Figure 8
Co-localization and expression of ΔLRRK2 and α-synA53T 6 weeks after the co-injection of AAV-α-synA53T with either AAV-ΔLRRK2G2019S or AAV-ΔLRRK2G2019S/D1994A. (A,B) Photomicrographs showing the results of immuno-fluorescence detection of ΔLRRK2G2019S (ΔLRRK2GS) or ΔLRRK2G2019S/D1994A (ΔLRRK2DK–red channel) and α-syn (green channel). Left and right images were obtained at low (A) and high (B) magnification, respectively. Note that most neurons express both transgenes. Scale bars: 200 µm for the top images, 50 µm for the bottom images in (A), and 10 µm for the bottom images in (B). (C) Quantification of the percentage of co-localization (upper histogram), α-syn fluorescence (middle histogram), and ΔLRRK2 fluorescence (bottom histogram) based on the analysis of 20 cells per animal, 180 cells in total. Results are expressed as the means ± SEM. N = 4–5 animals/group. No statistical difference between groups, Student’s t-test.
Figure 9
Figure 9
Microglial activation induced by α-synA53T is not modified by overexpression of ΔLRRK2 fragments. Histological evaluation was performed six weeks after the injection of PBS or AAV-α-synA53T alone or AAV-α-synA53T mixed with either AAV-GFP, ΔLRRK2G2019S (ΔLRRK2GS), or the dead kinase form ΔLRRK2G2019S/D1994A (ΔLRRK2DK). Cells positive for IBA1 were detected by immunofluorescence and confocal microscopy and their cross-sectional area was determined by image analysis. (A) Photomicrographs of rat brain sections labeled for IBA1 immunoreactivity in the SNpc at low (upper images) and high (lower images) magnification in the various groups. (B) Quantification of the mean cross-sectional area of IBA1-positive cells. (C) Low (upper images) and high (lower images) magnification photomicrographs of rat brain sections labeled for IBA1 immunoreactivity in the striatum of rats in which the SNpc was injected with PBS or AAV-α-synA53T with AAV-encoding ΔLRRK2 constructs. (D) Quantification of the mean cross-sectional area of IBA1-positive cells. (E) Low (upper images) and high (lower images) magnification photomicrographs of rat brain sections labeled for IBA1 immunoreactivity in the SNpc of rats injected with AAV-GFP or AAV-α-synA53T alone. (F) Quantification of the mean cross-sectional area of IBA1-positive cells. Results are expressed as the mean percentage ± SEM of the staining of the control group (PBS in (AD), AAV-GFP in (E,F)). N = 8 animals/group in (BD) and 5 to 7 animals/group in (F). In (B), ANOVA and PLSD post hoc test B (SNpc), and Kruskal–Wallis and Mann–Whitney tests in (D) (striatum). (F), Unpaired Student’s t-test. * p < 0.05, ** p < 0.01, *** p < 0.0001. Scale bar: low magnification, 200 µm; high magnification, 50 µm.

Similar articles

Cited by

References

    1. Poewe W., Seppi K., Tanner C.M., Halliday G.M., Brundin P., Volkmann J., Schrag A.-E., Lang A.E. Parkinson Disease. Nat. Rev. Dis. Primers. 2017;3:17013. doi: 10.1038/nrdp.2017.13. - DOI - PubMed
    1. Rodriguez-Oroz M.C., Jahanshahi M., Krack P., Litvan I., Macias R., Bezard E., Obeso J.A. Initial Clinical Manifestations of Parkinson’s Disease: Features and Pathophysiological Mechanisms. Lancet Neurol. 2009;8:1128–1139. doi: 10.1016/S1474-4422(09)70293-5. - DOI - PubMed
    1. Braak H., Braak E. Pathoanatomy of Parkinson’s Disease. J. Neurol. 2000;247:II3-II10. doi: 10.1007/PL00007758. - DOI - PubMed
    1. Lesage S., Brice A. Parkinson’s Disease: From Monogenic Forms to Genetic Susceptibility Factors. Hum. Mol. Genet. 2009;18:R48–R59. doi: 10.1093/hmg/ddp012. - DOI - PubMed
    1. Chartier-Harlin M.C., Kachergus J., Roumier C., Mouroux V., Douay X., Lincoln S., Levecque C., Larvor L., Andrieux J., Hulihan M., et al. Alpha-Synuclein Locus Duplication as a Cause of Familial Parkinson’s Disease. Lancet. 2004;364:1167–1169. doi: 10.1016/S0140-6736(04)17103-1. - DOI - PubMed

MeSH terms

Substances

LinkOut - more resources