

Ratiometric Fluorescent Biosensors for Glucose and Lactate Using an Oxygen-Sensing Membrane
- PMID: 34202015
- PMCID: PMC8301843
- DOI: 10.3390/bios11070208
Ratiometric Fluorescent Biosensors for Glucose and Lactate Using an Oxygen-Sensing Membrane
Abstract
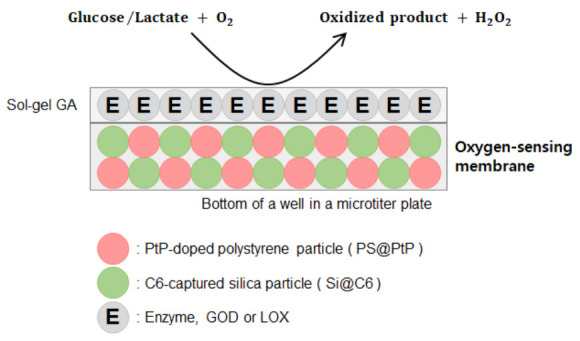
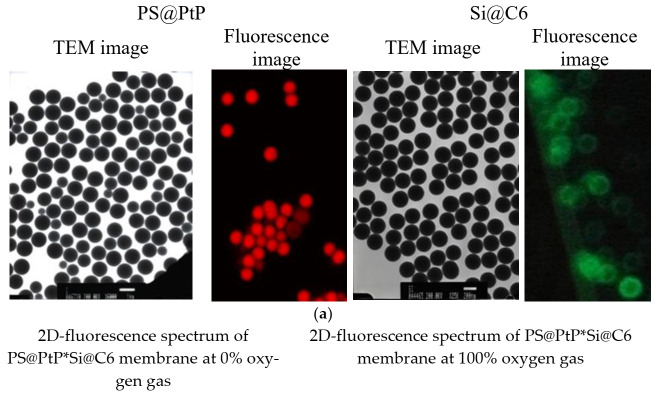
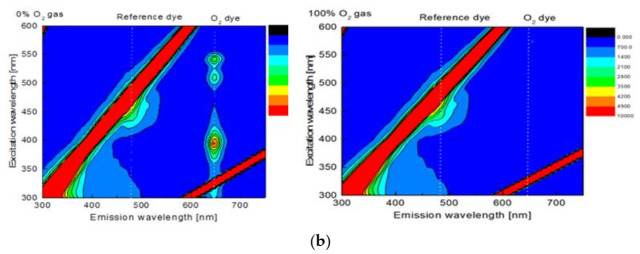
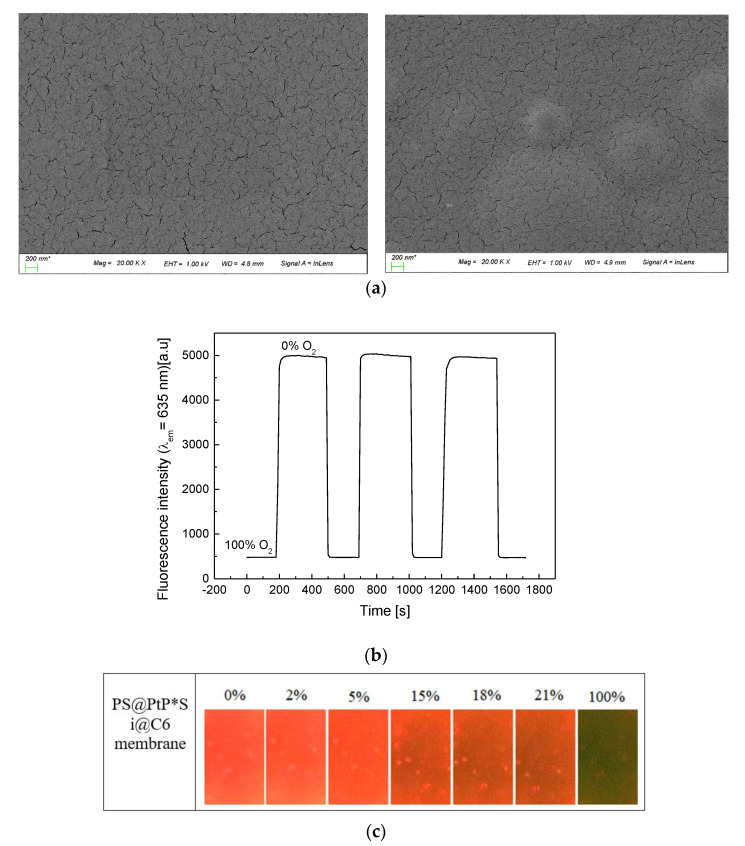
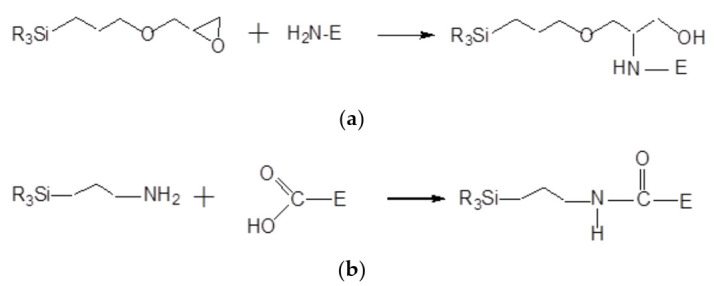
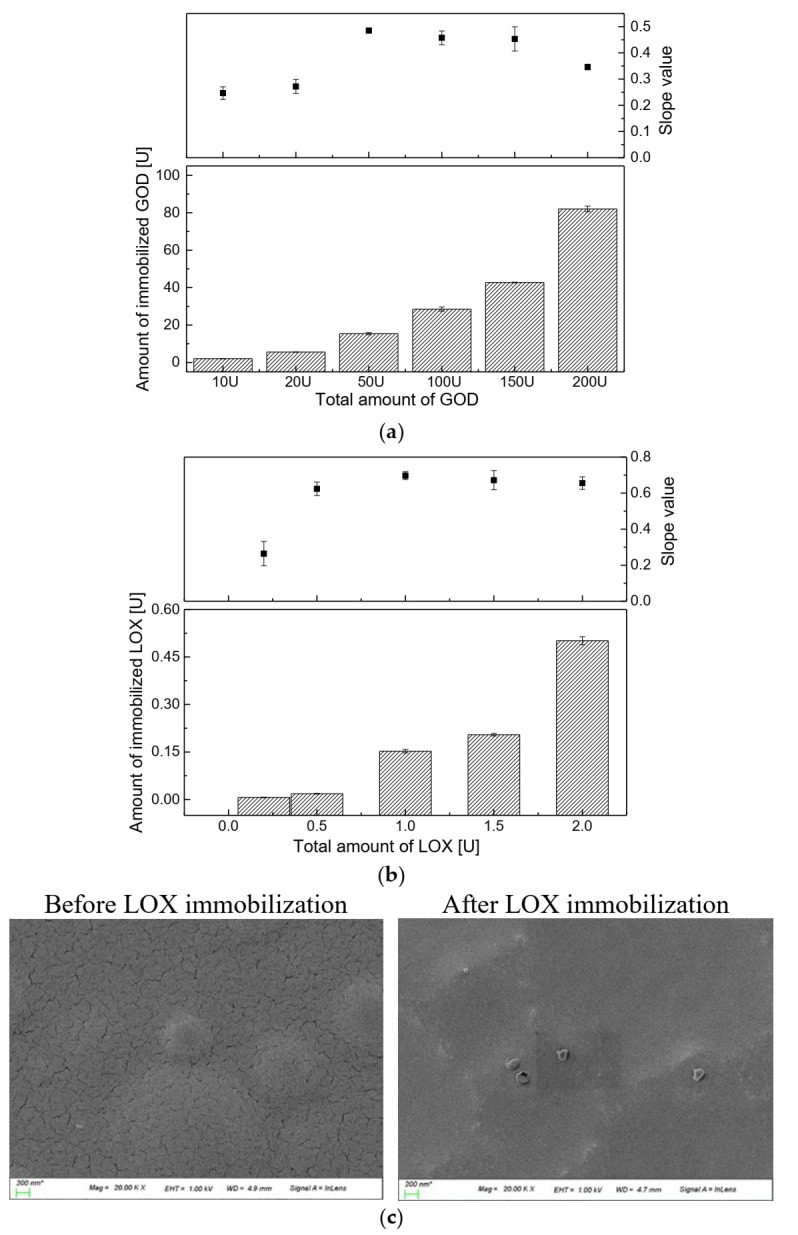
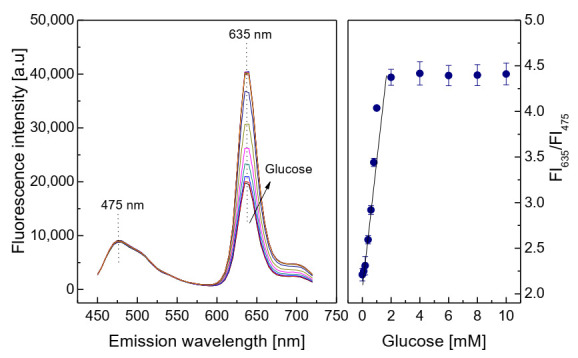
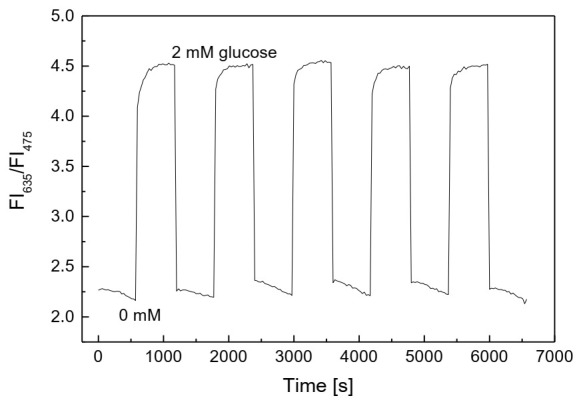
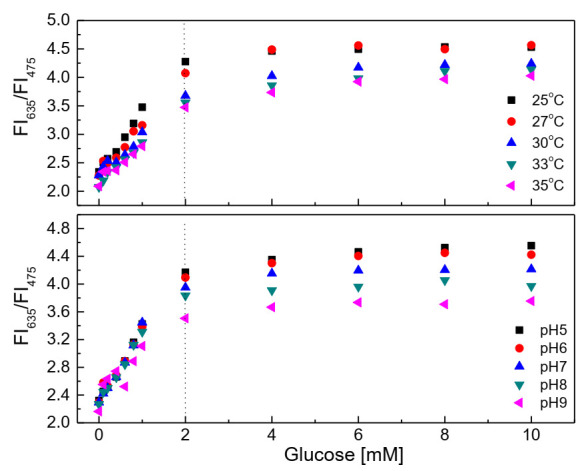
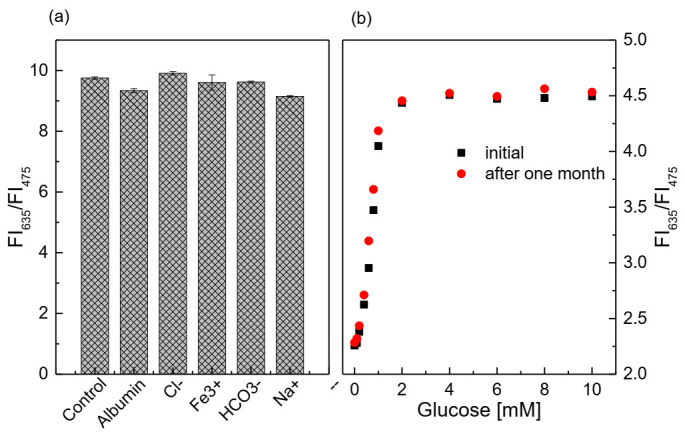
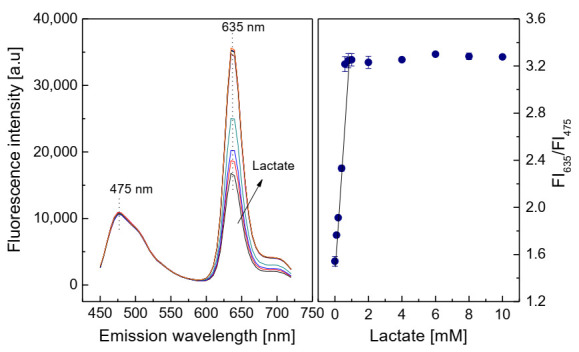
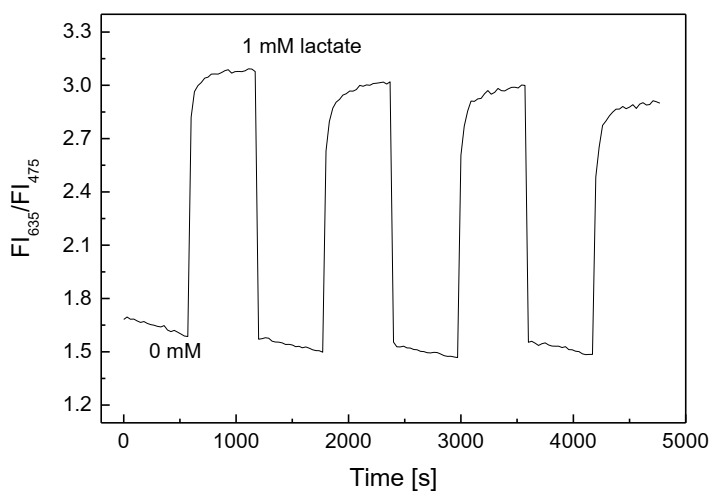
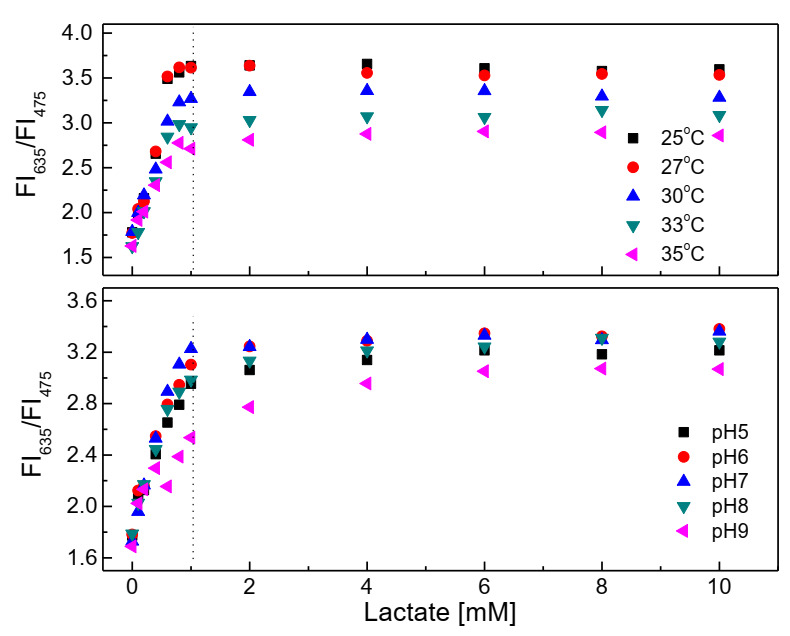
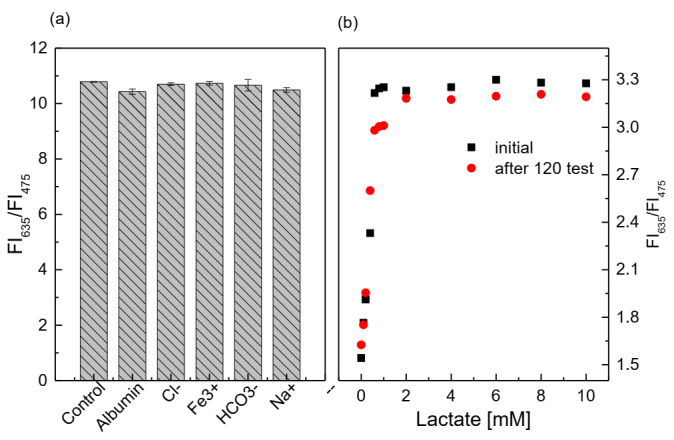
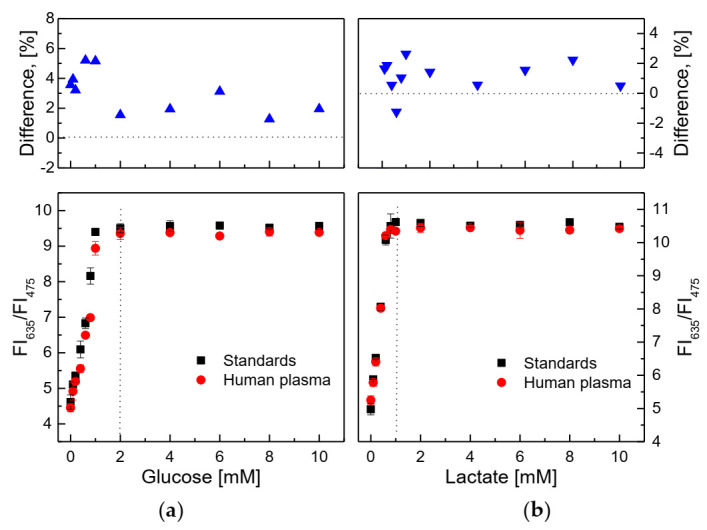
In this study, ratiometric fluorescent glucose and lactate biosensors were developed using a ratiometric fluorescent oxygen-sensing membrane immobilized with glucose oxidase (GOD) or lactate oxidase (LOX). Herein, the ratiometric fluorescent oxygen-sensing membrane was fabricated with the ratio of two emission wavelengths of platinum meso-tetra (pentafluorophenyl) porphyrin (PtP) doped in polystyrene particles and coumarin 6 (C6) captured into silica particles. The operation mechanism of the sensing membranes was based on (i) the fluorescence quenching effect of the PtP dye by oxygen molecules, and (ii) the consumption of oxygen levels in the glucose or lactate oxidation reactions under the catalysis of GOD or LOX. The ratiometric fluorescent glucose-sensing membrane showed high sensitivity to glucose in the range of 0.1-2 mM, with a limit of detection (LOD) of 0.031 mM, whereas the ratiometric fluorescent lactate-sensing membrane showed the linear detection range of 0.1-0.8 mM, with an LOD of 0.06 mM. These sensing membranes also showed good selectivity, fast reversibility, and stability over long-term use. They were applied to detect glucose and lactate in artificial human serum, and they provided reliable measurement results.
Keywords: coumarin 6; glucose oxidase; glucose sensor; lactate oxidase; lactate sensor; porphyrin dye; ratiometric fluorescent sensor.
Conflict of interest statement
The authors declare no conflict of interest.
Figures
Similar articles
-
Development of a Ratiometric Fluorescent Glucose Sensor Using an Oxygen-Sensing Membrane Immobilized with Glucose Oxidase for the Detection of Glucose in Tears.Biosensors (Basel). 2020 Jul 29;10(8):86. doi: 10.3390/bios10080086. Biosensors (Basel). 2020. PMID: 32751236 Free PMC article.
-
Ratiometric fluorescent capillary sensor for real-time dual-monitoring of pH and O2 fluctuation.Spectrochim Acta A Mol Biomol Spectrosc. 2025 Feb 15;327:125388. doi: 10.1016/j.saa.2024.125388. Epub 2024 Nov 3. Spectrochim Acta A Mol Biomol Spectrosc. 2025. PMID: 39515235
-
Development of novel optical pH sensors based on coumarin 6 and nile blue A encapsulated in resin particles and specific support materials.Mater Sci Eng C Mater Biol Appl. 2020 Feb;107:110323. doi: 10.1016/j.msec.2019.110323. Epub 2019 Oct 22. Mater Sci Eng C Mater Biol Appl. 2020. PMID: 31761237
-
Lactate biosensing: The emerging point-of-care and personal health monitoring.Biosens Bioelectron. 2018 Oct 15;117:818-829. doi: 10.1016/j.bios.2018.06.054. Epub 2018 Jun 28. Biosens Bioelectron. 2018. PMID: 30096736 Review.
-
Current Progress on Antibiotic Sensing Based on Ratiometric Fluorescent Sensors.Bull Environ Contam Toxicol. 2021 Aug;107(2):176-184. doi: 10.1007/s00128-020-02946-2. Epub 2020 Aug 3. Bull Environ Contam Toxicol. 2021. PMID: 32747994 Review.
Cited by
-
Simultaneous detection of urea and lactate in sweat based on a wearable sweat biosensor.Biomed Opt Express. 2023 Dec 4;15(1):14-27. doi: 10.1364/BOE.505004. eCollection 2024 Jan 1. Biomed Opt Express. 2023. PMID: 38223175 Free PMC article.
-
A Comprehensive Review of Advanced Lactate Biosensor Materials, Methods, and Applications in Modern Healthcare.Sensors (Basel). 2025 Feb 10;25(4):1045. doi: 10.3390/s25041045. Sensors (Basel). 2025. PMID: 40006275 Free PMC article. Review.
-
Dual-Color Fluorescent Hydrogel Microspheres Combined with Smartphones for Visual Detection of Lactate.Biosensors (Basel). 2022 Sep 28;12(10):802. doi: 10.3390/bios12100802. Biosensors (Basel). 2022. PMID: 36290939 Free PMC article.
-
Recent Advances in Wearable Biosensors for Non-Invasive Detection of Human Lactate.Biosensors (Basel). 2022 Dec 13;12(12):1164. doi: 10.3390/bios12121164. Biosensors (Basel). 2022. PMID: 36551131 Free PMC article. Review.
-
Micro- and nanosensors for detecting blood pathogens and biomarkers at different points of sepsis care.Mikrochim Acta. 2022 Jan 26;189(2):74. doi: 10.1007/s00604-022-05171-2. Mikrochim Acta. 2022. PMID: 35080669 Free PMC article. Review.
References
MeSH terms
Substances
Grants and funding
LinkOut - more resources
Full Text Sources
