. 2021 Jun 25;10(13):2795.
doi: 10.3390/jcm10132795.

Changes in the Allostatic Response to Whole-Body Cryotherapy and Static-Stretching Exercises in Chronic Fatigue Syndrome Patients vs. Healthy Individuals

Affiliations

Changes in the Allostatic Response to Whole-Body Cryotherapy and Static-Stretching Exercises in Chronic Fatigue Syndrome Patients vs. Healthy Individuals

Sławomir Kujawski et al. J Clin Med. .

Abstract

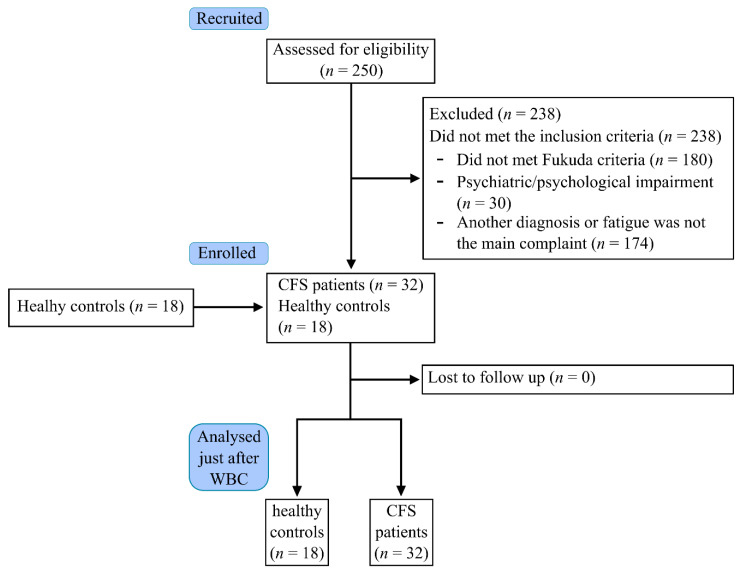
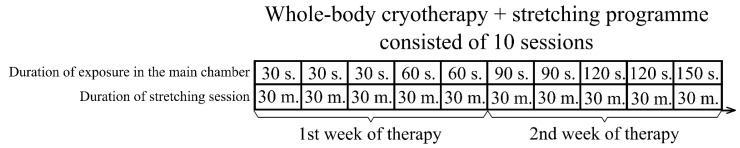
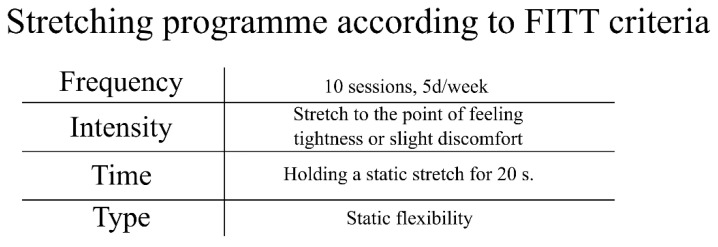
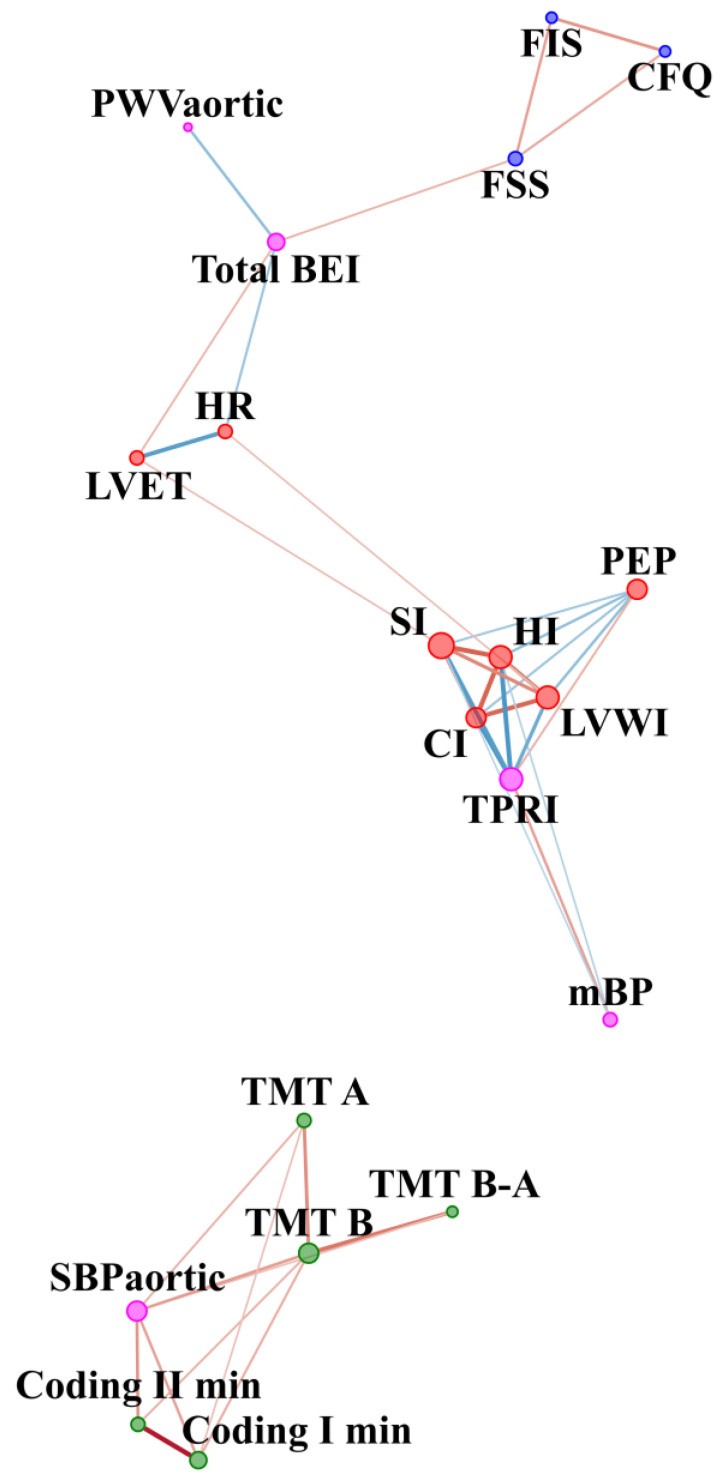
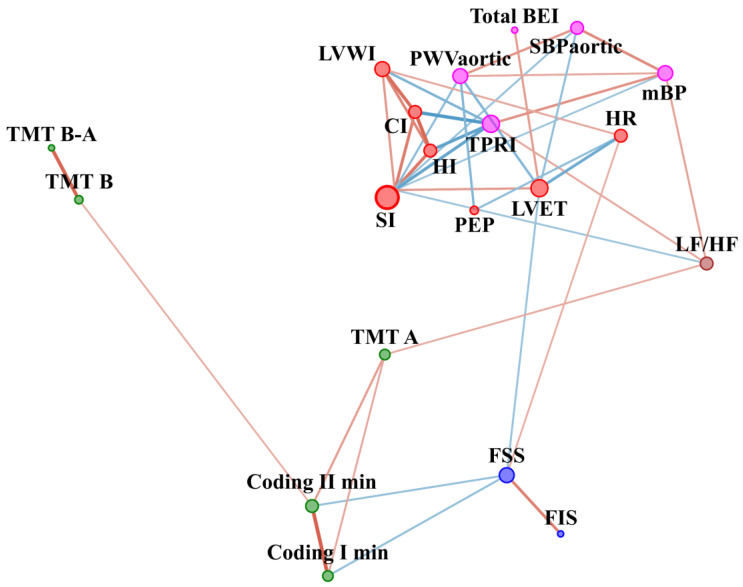
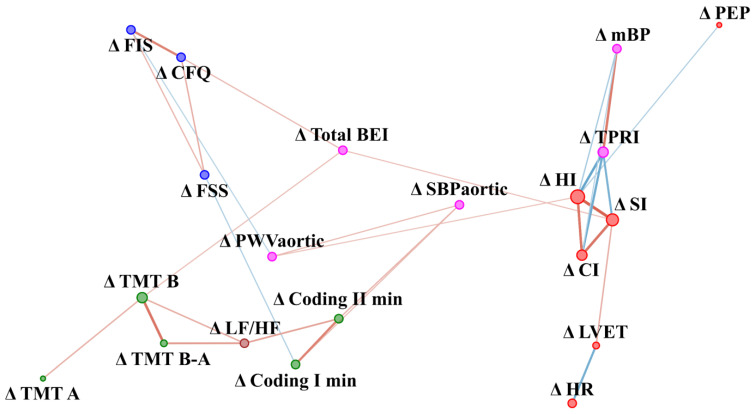
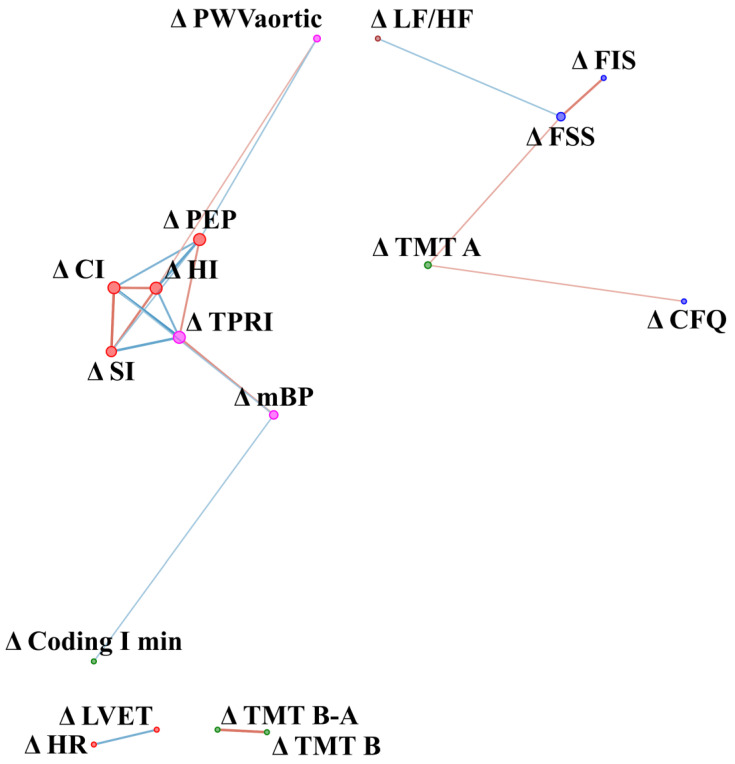
This study represents a comparison of the functional interrelation of fatigue and cognitive, cardiovascular and autonomic nervous systems in a group of Chronic Fatigue Syndrome (CFS) patients compared with those in healthy individuals at different stages of analysis: at baseline and after changes induced by whole-body cryotherapy (WBC) combined with a static-stretching (SS) program. The study included 32 patients (Fukuda criteria) and 18 healthy controls. Fatigue, cognitive, cardiovascular and autonomic function and arterial stiffness were measured before and after 10 sessions of WBC with SS. In the patients, a disturbance in homeostasis was observed. The network relationship based on differences before and after intervention showed comparatively higher stress and eccentricity in the CFS group: 50.9 ± 56.1 vs. 6.35 ± 8.72, p = 0.002, r = 0.28; and 4.8 ± 0.7 vs. 2.4 ± 1, p < 0.001, r = 0.46, respectively. Before and after intervention, in the CFS group increased fatigue was related to baroreceptor function, and baroreceptor function was in turn related to aortic stiffness, but no such relationships were observed in the control group. Differences in the network structure underlying the interrelation among the four measured criteria were observed in both groups, before the intervention and after ten sessions of whole cryotherapy with a static stretching exercise.

Keywords: cold therapy; physical activity; stretching.


Conflict of interest statement

The authors declare no conflict of interest.

Figures

Figure 1
Figure 1
Flow chart of the study.
Figure 2
Figure 2
Whole-body cryotherapy with stretching intervention timeline.
Figure 3
Figure 3
Whole-body cryotherapy with stretching frequency, intensity, time and type (FITT) according to ACSM criteria [29].
Figure 4
Figure 4
Network analysis in CFS patients before WBC and SS therapy. The variables were grouped according to categories illustrated by colour of nodes: cognitive function (green), fatigue scales (blue), vascular system function (magenta) and cardiac muscle function (red). The size of the dots next to the variable names is continuously related to the number of statistically significant correlation coefficients with other variables. The colour of edges denotes the sign of correlation: blue indicate negative, while red indicates positive correlation. Edge width and intensity of colour denote strength of relationship. CFQ—Chronic Fatigue Scale, FSS—Fatigue Severity Scale, FIS—Fatigue Impact Scale, HR—Hear Rate, SI—Stroke Index, HI—Heather index, PEP—Pre-ejection period, LVET—Left Ventricular Ejection Time, CI—Cardiac Index, LVWI—Left Ventricle Work Index, TPRI—Total Peripheral Resistance Index, mBP—Mean Blood Pressure, PWVaortic—Aortic Pulse Wave Velocity, SBPaortic—central systolic blood pressure, Total BEI—baroreceptor effectiveness index, TMT A—Trial Making Test part A, TMT B—Trial Making Test part B, TMT B-A—Difference in result between TMT B and TMT A, Coding I—number of words left after first minute of coding test; Coding II—number of words left after second minute of coding test.
Figure 5
Figure 5
Network analysis in the control group before WBC and SS therapy. The variables were grouped according to categories illustrated by colour of nodes: cognitive function (green), fatigue scales (blue), vascular system function (magenta) cardiac muscle function (red), autonomic nervous system function (brown). The size of the dots next to the variable names is continuously related to the number of statistically significant correlation coefficients with other variables. The colour of the edges denotes the sign of correlation: blue indicates negative, while red indicates positive. Edge width and intensity of colour denote strength of relationship. CFQ—Chronic Fatigue Scale, FSS—Fatigue Severity Scale, FIS—Fatigue Impact Scale, HR—Hear Rate, SI—Stroke Index, HI—Heather index, PEP—Pre-ejection period, LVET—Left Ventricular Ejection Time, CI—Cardiac Index, LVWI—Left Ventricle Work Index, TPRI—Total Peripheral Resistance Index, mBP—Mean Blood Pressure, PWVaortic—Aortic Pulse Wave Velocity, SBPaortic—central systolic blood pressure, Total BEI—baroreceptor effectiveness index, LF/HF—sympathovagal balance, TMT A—Trial Making Test part A, TMT B—Trial Making Test part B, TMT B-A—Difference in result between TMT B and TMT A, Coding I—number of words left after first minute of coding test; Coding II—number of words left after second minute of coding test.
Figure 6
Figure 6
Network analysis of difference in parameters value before and after WBC and SS therapy in CFS patients. The variables were grouped according to categories illustrated by colour of nodes: cognitive function (green), fatigue scales (blue), vascular system function (magenta), cardiac muscle function (red) and autonomic nervous system function (brown). The size of the dots next to the variable names is continuously related to the number of statistically significant correlation coefficients with other variables. Colour of edges denotes sign of correlation: blue indicate negative, while red indicates positive correlation. Edge width and intensity of colour denote the strength of the relationship. Δ (delta) refers to differences in result before and after the WBC and stretching programme. CFQ—Chronic Fatigue Scale, FSS—Fatigue Severity Scale, FIS—Fatigue Impact Scale, HR—Hear Rate, SI—Stroke Index, HI—Heather index, PEP—Pre-ejection period, LVET—Left Ventricular Ejection Time, CI—Cardiac Index, LVWI—Left Ventricle Work Index, TPRI—Total Peripheral Resistance Index, mBP—Mean Blood Pressure, PWVaortic—Aortic Pulse Wave Velocity, SBPaortic—central systolic blood pressure, Total BEI—baroreceptor effectiveness index, LF/HF—sympathovagal balance, TMT A—Trial Making Test part A, TMT B—Trial Making Test part B, TMT B-A—Difference in result between TMT B and TMT A, Coding I—number of words left after first minute of coding test; Coding II—number of words left after second minute of coding test.
Figure 7
Figure 7
Network analysis of difference in parameters value after-before (delta) WBC and SS therapy in control group. The variables were grouped according to categories illustrated by colour of nodes: cognitive function (green), fatigue scales (blue), vascular system function (magenta, cardiac muscle function (red), autonomic nervous system function (brown). The size of the dots next to the variable names is continuously related to the number of statistically significant correlation coefficients with other variables. Colour of edges denote sign of correlation: blue indicates negative while red indicates positive correlation. Edge width and intensity of colour denote strength of relationship. Δ (delta) refers to difference in result before and after WBC and stretching program. CFQ—Chronic Fatigue Scale, FSS—Fatigue Severity Scale, FIS—Fatigue Impact Scale, HR—Hear Rate, SI—Stroke Index, HI—Heather index, PEP—Pre-ejection period, LVET—Left Ventricular Ejection Time, CI—Cardiac Index, LVWI—Left Ventricle Work Index, TPRI—Total Peripheral Resistance Index, mBP—Mean Blood Pressure, PWVaortic—Aortic Pulse Wave Velocity, SBPaortic—central systolic blood pressure, Total BEI—baroreceptor effectiveness index, LF/HF—sympathovagal balance, TMT A—Trial Making Test part A, TMT B—Trial Making Test part B, TMT B-A—Difference in result between TMT B and TMT A, Coding I—number of words left after first minute of coding test; Coding II—number of words left after second minute of coding test.

Similar articles

Cited by

References

    1. Gizińska M., Rutkowski R., Romanowski W., Lewandowski J., Straburzyńska-Lupa A. Effects of Whole-Body Cryotherapy in Comparison with Other Physical Modalities Used with Kinesitherapy in Rheumatoid Arthritis. BioMed Res. Int. 2015;2015:1–7. doi: 10.1155/2015/409174. - DOI - PMC - PubMed
    1. Kulis A., Misiorek A., Marchewka J., Głodzik J., Teległów A., Dąbrowski Z., Marchewka A. Effect of whole-body cryotherapy on the rheological parameters of blood in older women with spondyloarthrosis. Clin. Hemorheol. Microcirc. 2017;66:187–195. doi: 10.3233/CH-160230. - DOI - PubMed
    1. Banfi G., Lombardi G., Colombini A., Melegati G., Banfi P.G. Whole-Body Cryotherapy in Athletes. Sports Med. 2010;40:509–517. doi: 10.2165/11531940-000000000-00000. - DOI - PubMed
    1. Vitenet M., Tubez F., Marreiro A., Polidori G., Taiar R., Legrand F., Boyer F. Effect of whole body cryotherapy interventions on health-related quality of life in fibromyalgia patients: A randomized controlled trial. Complement. Ther. Med. 2018;36:6–8. doi: 10.1016/j.ctim.2017.10.011. - DOI - PubMed
    1. Zalewski P., Bitner A., Słomko J., Szrajda J., Klawe J.J., Tafil-Klawe M., Newton J.L. Whole-body cryostimulation increases parasympathetic outflow and decreases core body temperature. J. Therm. Biol. 2014;45:75–80. doi: 10.1016/j.jtherbio.2014.08.001. - DOI - PubMed

LinkOut - more resources