. 2021 Jun 25;10(7):1021.
doi: 10.3390/antiox10071021.

RT001 in Progressive Supranuclear Palsy-Clinical and In-Vitro Observations

Affiliations

RT001 in Progressive Supranuclear Palsy-Clinical and In-Vitro Observations

Plamena R Angelova et al. Antioxidants (Basel). .

Abstract

Background: Progressive supranuclear palsy (PSP) is a progressive movement disorder associated with lipid peroxidation and intracerebral accumulation of tau. RT001 is a deuterium reinforced isotopologue of linoleic acid that prevents lipid peroxidation (LPO) through the kinetic isotope effect.

Methods: The effects of RT001 pre-treatment on various oxidative and bioenergetic parameters were evaluated in mesenchymal stem cells (MSC) derived from patients with PSP compared to controls. In parallel, 3 patients with PSP were treated with RT001 and followed clinically.

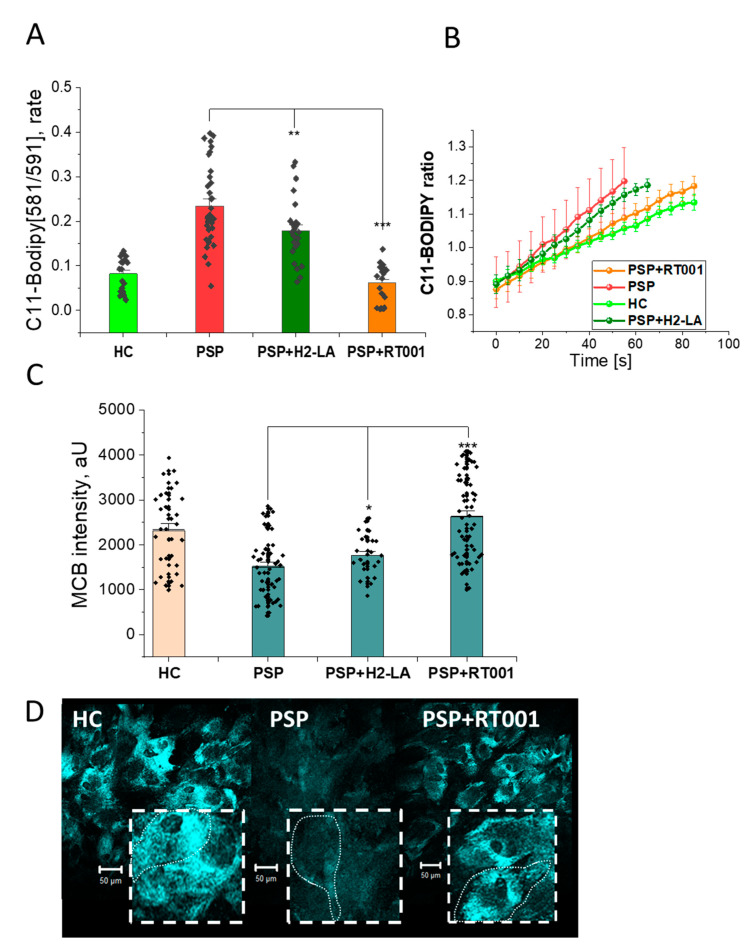
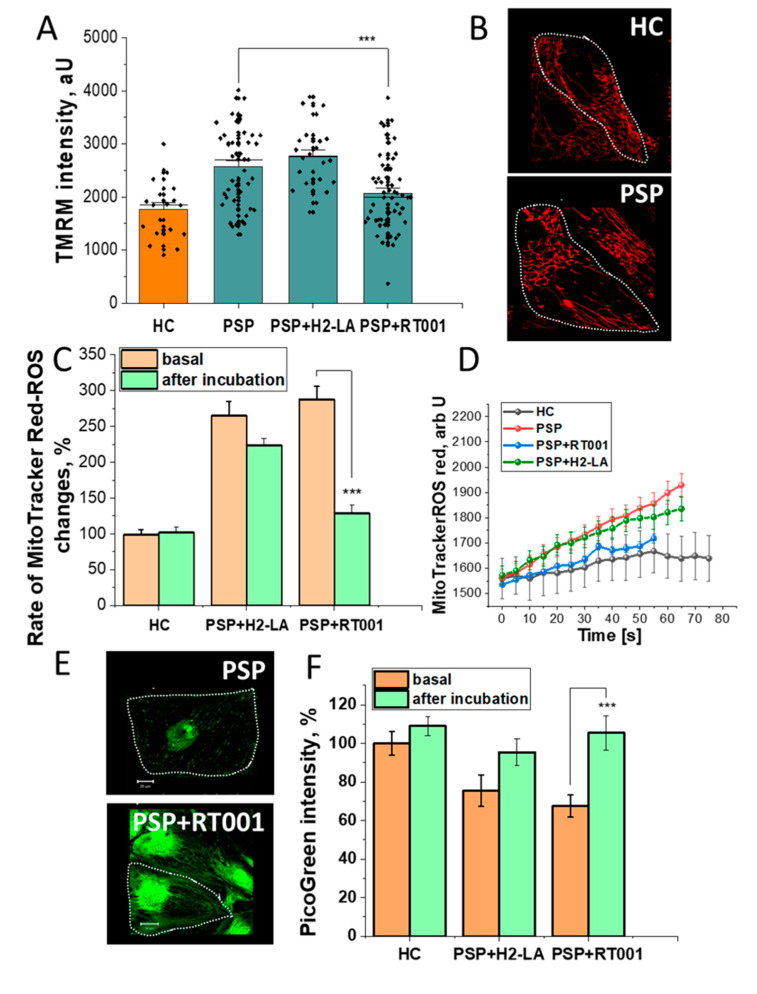
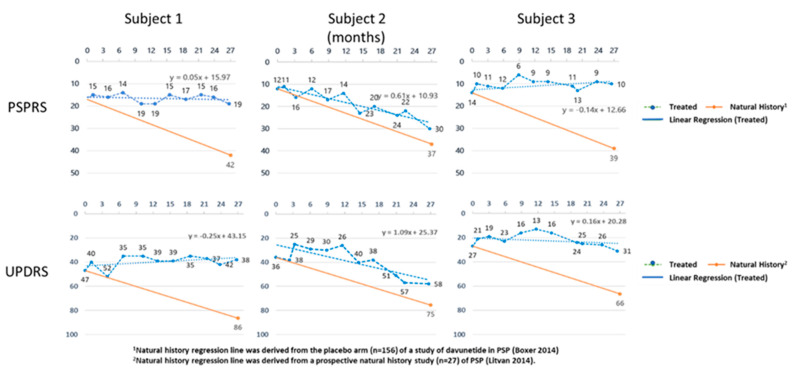
Results: MSCs derived from PSP patients had a significantly higher rate of LPO (161.8 ± 8.2% of control; p < 0.001). A 72-h incubation with RT001 restored the PSP MSCs to normal levels. Mitochondrial reactive oxygen species (ROS) overproduction in PSP-MSCs significantly decreased the level of GSH compared to control MSCs (to 56% and 47% of control; p < 0.05). Incubation with RT001 significantly increased level of GSH in PSP MSCs. The level of mitochondrial DNA in the cells was significantly lower in PSP-MSCs (67.5%), compared to control MSCs. Changes in mitochondrial membrane potential, size, and shape were also observed. Three subjects with possible or probable PSP were treated with RT001 for a mean duration of 26 months. The slope of the PSPRS changed from the historical decline of 0.91 points/month to a mean decline of 0.16 points/month (+/-0.23 SEM). The UPDRS slope changed from an expected increase of 0.95 points/month to an average increase in score of 0.28 points/month (+/-0.41 SEM).

Conclusions: MSCs derived from patients with PSP have elevated basal levels of LPO, ROS, and mitochondrial dysfunction. These findings are reversed after incubation with RT001. In PSP patients, the progression of disease may be reduced by treatment with RT001.

Keywords: PSP; PUFA; RT001; deuteration; lipid peroxidation; mesenchymal stem cells.


Conflict of interest statement

Authors P.A., K.A., and M.B. have no competing interest to declare. Author O.T. is employed by Retrotope. Authors M.G.M., P.A., P.M., F.H., and M.S. are stockholders and employees of Retrotope. The company had no role in the design of the study; in the collection, analyses, or interpretation of data; in the writing of the manuscript, or in the decision to publish the results.

Figures

Figure 1
Figure 1
Effects of RT001 on the oxidative status of MSCs derived from healthy controls (HC) and patients with PSP (PSP). (Panel A) Bar chart quantification of the efficacy of RT001 on the rate of lipid peroxidation using C11-Bodipy (PSP alone vs. PSP + RT001, p < 0.0001). (Panel B) Representative time course traces of lipid peroxidation in MSCs derived from HC (light green), and PSP (red), PSP treated with RT001 (orange), and PSP treated with H2-LA (dark green), respectively. (Panel C) Measurements of monochlorobimane (MCB) fluorescence intensity as an indicator of glutathione (GSH) levels (PSP alone vs. PSP + RT001, p < 0.0001). (Panel D) Representative images showing MCB (GSH) fluorescence intensity for HC, PSP, and PSP + RT001. MCB intensity is reduced in PSP compared to HC, but is restored after incubation with RT001. The coarse dash lines approximate the cell borders of an individual MSC (fine dash line). Data are represented as mean ± SEM. Total number of cells per well n = 10–50 from 3–6 culturing wells. All experiments were repeated 2–3 times (N, independent culturing conditions). * p < 0.05, ** p < 0.001, *** p < 0.0001.
Figure 2
Figure 2
Protective effects of RT001 on mitochondrial function in PSP-MSCs. (Panel A) Histogram demonstrating the mitochondrial membrane potential (Δψm) measured using the fluorescence intensity of TMRM (tetramethylrhodamine). Δψm was increased in PSP MSCs compared to HC. Δψm was reduced after incubation with RT001, but not after incubation with H2-LA (p = 0.0009). (Panel B) Representative images depicting the mitochondrial shape, distribution, and fluorescence intensity at baseline for HC and PSP MSCs (fine dash line represents the approximate cell border of a MSC). (Panel C) Quantitative histogram of MitoTrackerCM-H2Xros fluorescence intensity shows baseline elevations in ROS in the PSP MSCs were reduced to near normal levels after incubation with RT001 (p < 0.0001), but not after incubation with H2-LA (p = 0.0801). (Panel D) MitoTrackerCM-H2Xros fluorescence over time for HC, baseline PSP, PSP + RT001, and PSP + H2-LA. Baseline fluorescence elevations for the PSP MSCs over HC MSCs were restored to near normal after RT001, but not after H2-LA incubation. (Panel E) Representative images of the mitochondrial DNA content of PSP MSCs at baseline (top panel). (Panel F) Quantification bar chart of the PicoGreen Intensity as a measure of mitochondrial DNA content. Baseline (orange columns) reductions in mitochondrial DNA were seen in the PSP MSCs (middle and right histograms). Incubation with H2-LA (middle histogram) resulted in a small increase in mitochondrial DNA (middle histogram, green column; p = 0.0689), while RT001 restored PSP MSCs to normal levels (right histogram, green column; p = 0.0010). Data are represented as mean ± SEM. Total number of cells per well n = 10–50 from 3–6 culturing wells. All experiments were repeated 2 – 3 times (N, independent culturing conditions). * p < 0.05, ** p < 0.001, *** p < 0.0001.
Figure 3
Figure 3
The PSPRS and UPDRS scores for the three subjects are shown over time. The orange line indicates the expected change in scores based on historical control subjects obtained from the placebo arm of a clinical trial in PSP patients for the PSPRS [22], and in a natural history study of PSP for the UPDRS [23].

References

    1. Steele J.C., Richardson J.C., Olszewski J. Progressive supranuclear palsy. A heterogeneousdegeneration involving the brain stem, basal ganglia and cerebellum with vertical gaze and pseudobulbar palsy, nuchal dystonia and dementia. Arch. Neurol. 1964;10:333–359. doi: 10.1001/archneur.1964.00460160003001. - DOI - PubMed
    1. O’Sullivan S.S., Massey L.A., Williams D.R., Silveira-Moriyama L., Kempster P.A., Holton J.L., Revesz T., Lees A.J. Clinical outcomes of progressive supranuclear palsy and multiple system atrophy. Brain. 2008;131:1362–1372. doi: 10.1093/brain/awn065. - DOI - PubMed
    1. Chiu W.Z., Kaat L.D., Seelaar H., Rosso S.M., Boon A.J., Kamphorst W., Van Swieten J.C. Survival in progressive supranuclear palsy and frontotemporal dementia. J. Neurol. Neurosurg. Psychiatry. 2010;81:441–445. doi: 10.1136/jnnp.2009.195719. - DOI - PubMed
    1. Höglinger G.U., Respondek G., Stamelou M., Kurz C., Josephs K.A., Lang A.E., Mollenhauer B., Müller U., Nilsson C., Whitwell J.L., et al. Clinical diagnosis of progressive supranuclear palsy: The movement disorder society criteria. Mov. Disord. 2017;32:853–864. doi: 10.1002/mds.26987. - DOI - PMC - PubMed
    1. Armstrong M.J., Litvan I., Lang A.E., Bak T.H., Bhatia K.P., Borroni B., Boxer A.L., Dickson D.W., Grossman M., Hallett M., et al. Criteria for the diagnosis of corticobasal degeneration. Neurology. 2013;80:496–503. doi: 10.1212/WNL.0b013e31827f0fd1. - DOI - PMC - PubMed