

RETRACTED: Thymoquinone and Curcumin Defeat Aging-Associated Oxidative Alterations Induced by D-Galactose in Rats' Brain and Heart
- PMID: 34202112
- PMCID: PMC8268720
- DOI: 10.3390/ijms22136839
RETRACTED: Thymoquinone and Curcumin Defeat Aging-Associated Oxidative Alterations Induced by D-Galactose in Rats' Brain and Heart
Retraction in
-
RETRACTED: El-Far et al. Thymoquinone and Curcumin Defeat Aging-Associated Oxidative Alterations Induced by D-Galactose in Rats' Brain and Heart. Int. J. Mol. Sci. 2021, 22, 6839.Int J Mol Sci. 2024 Dec 5;25(23):13063. doi: 10.3390/ijms252313063. Int J Mol Sci. 2024. PMID: 39660544 Free PMC article.
Abstract
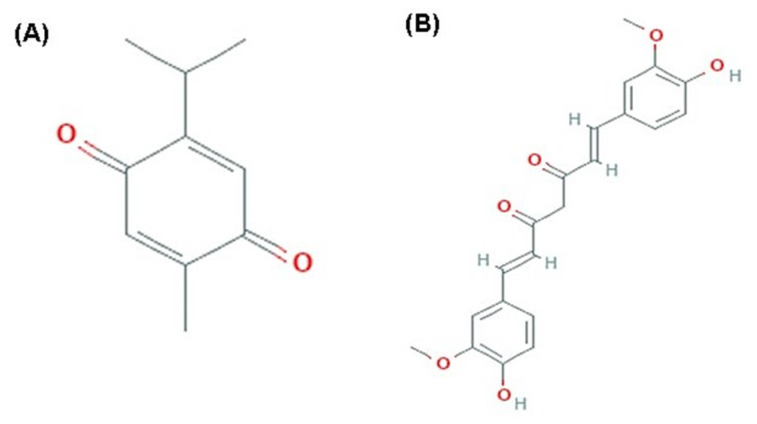
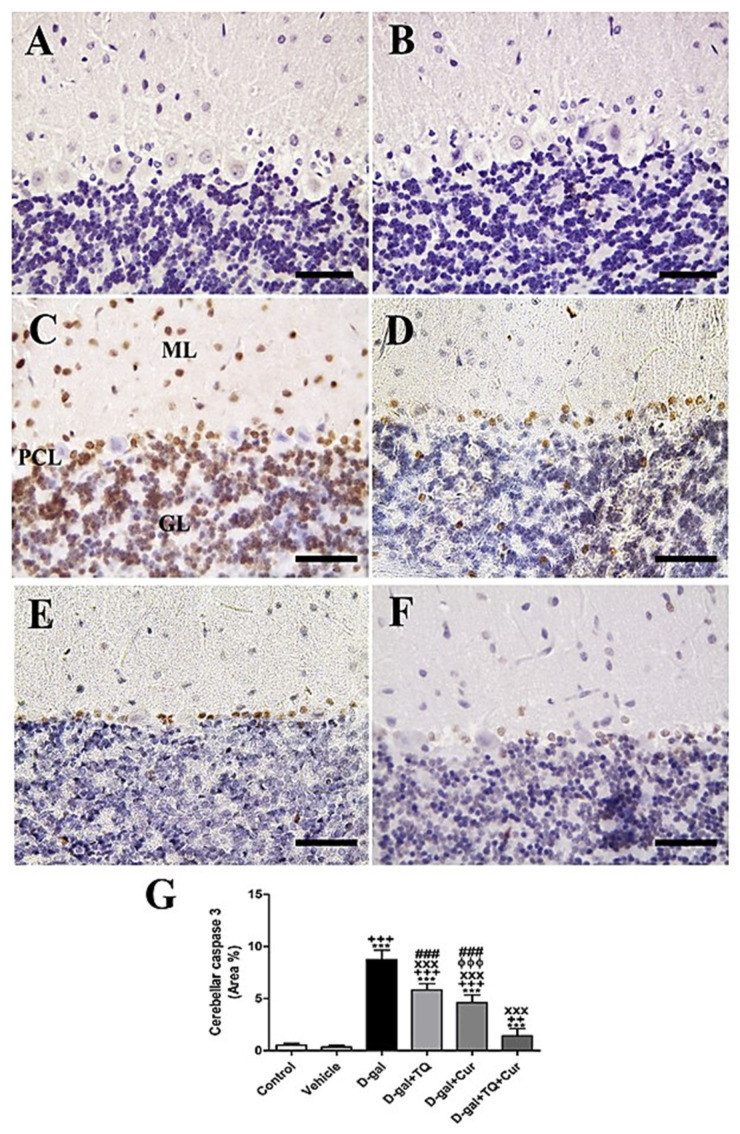
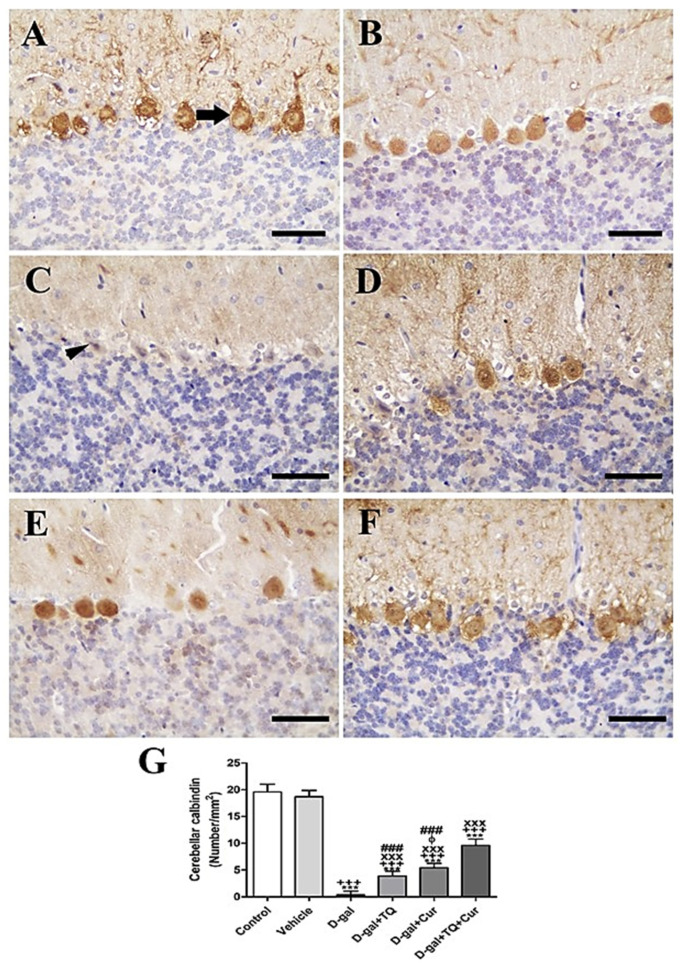
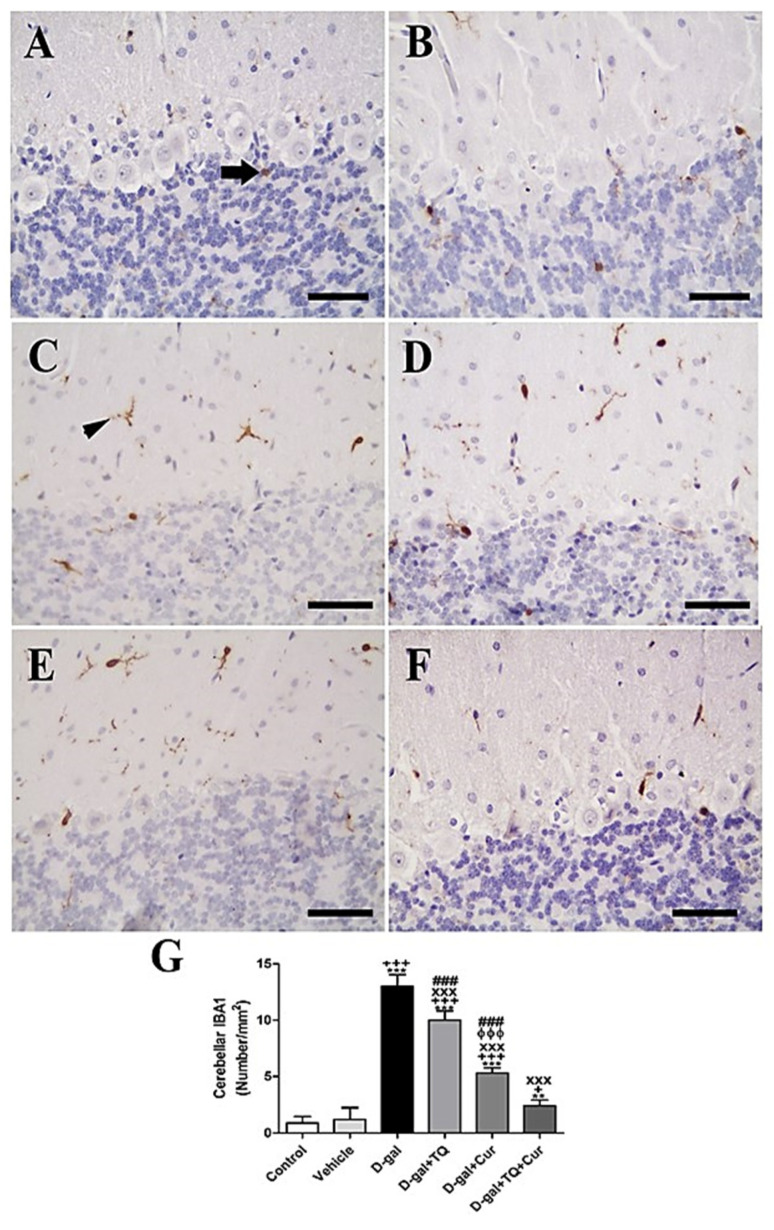
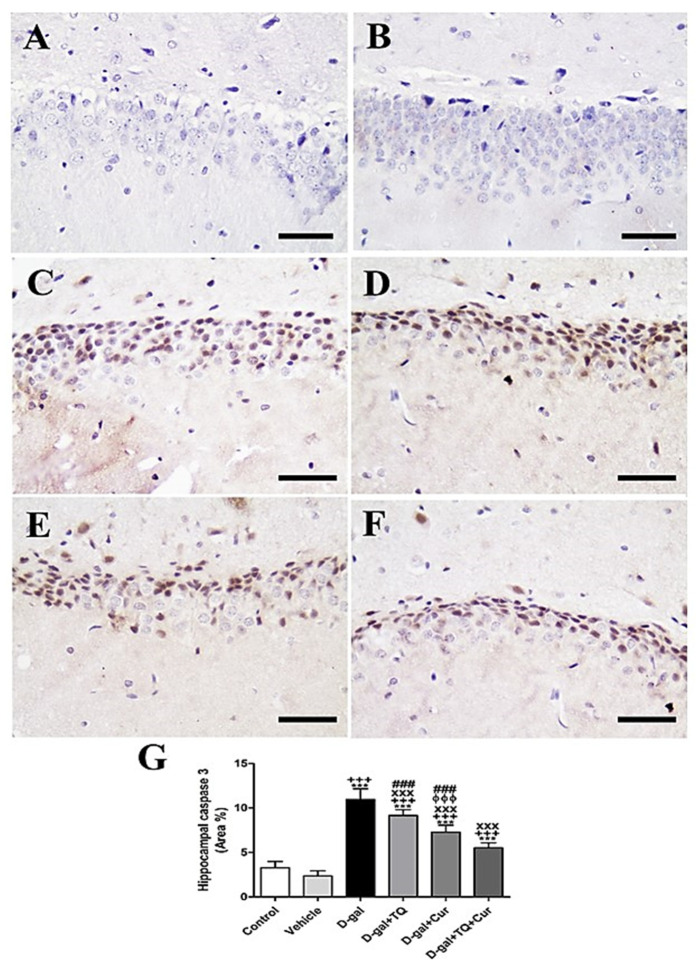
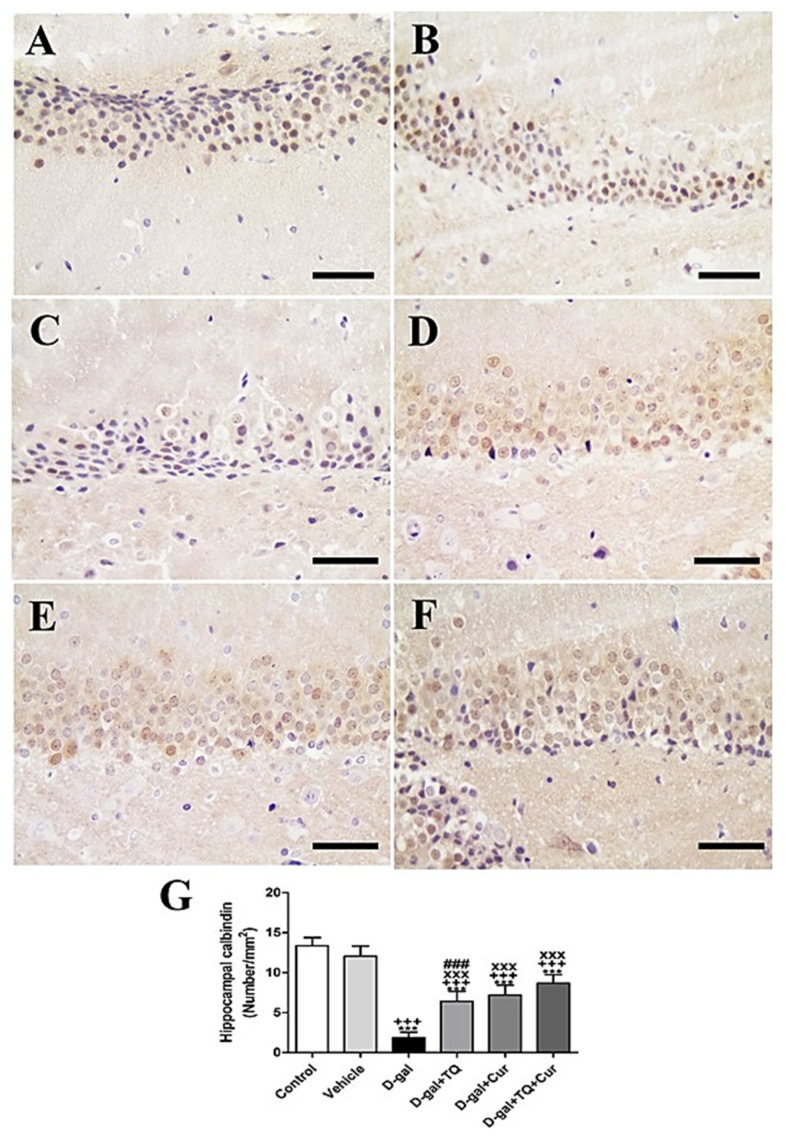
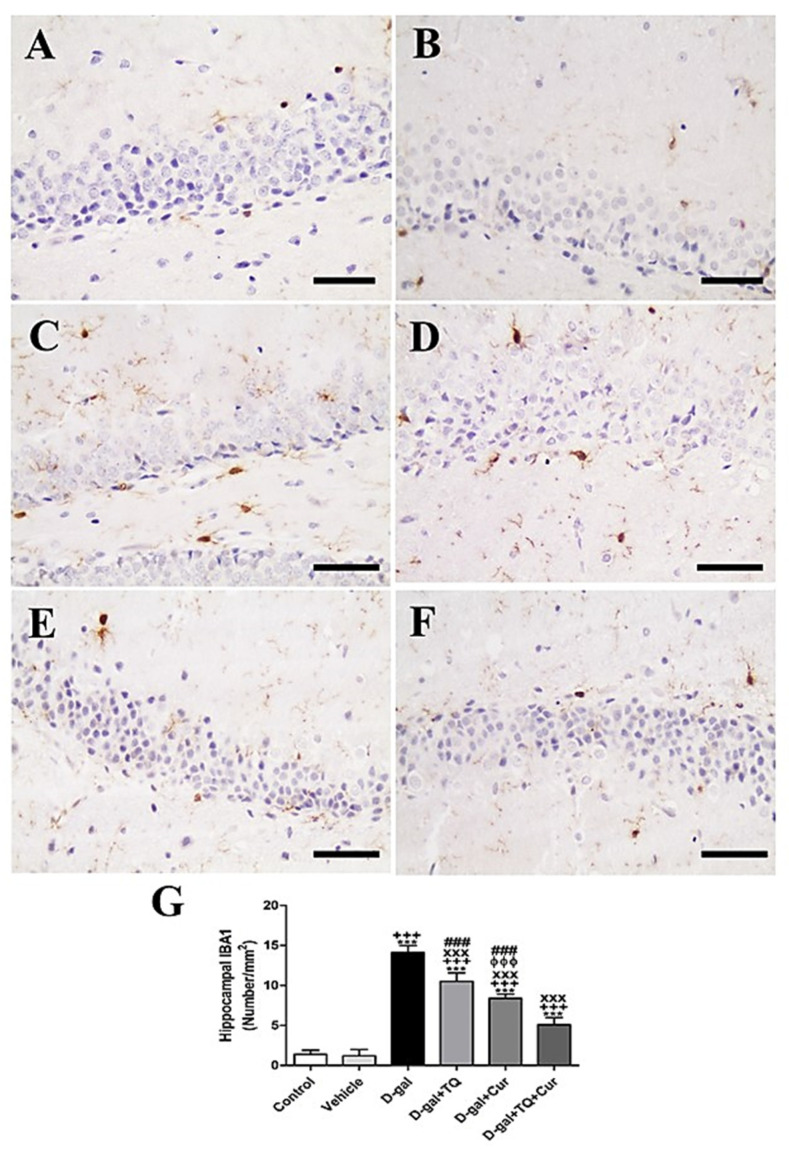
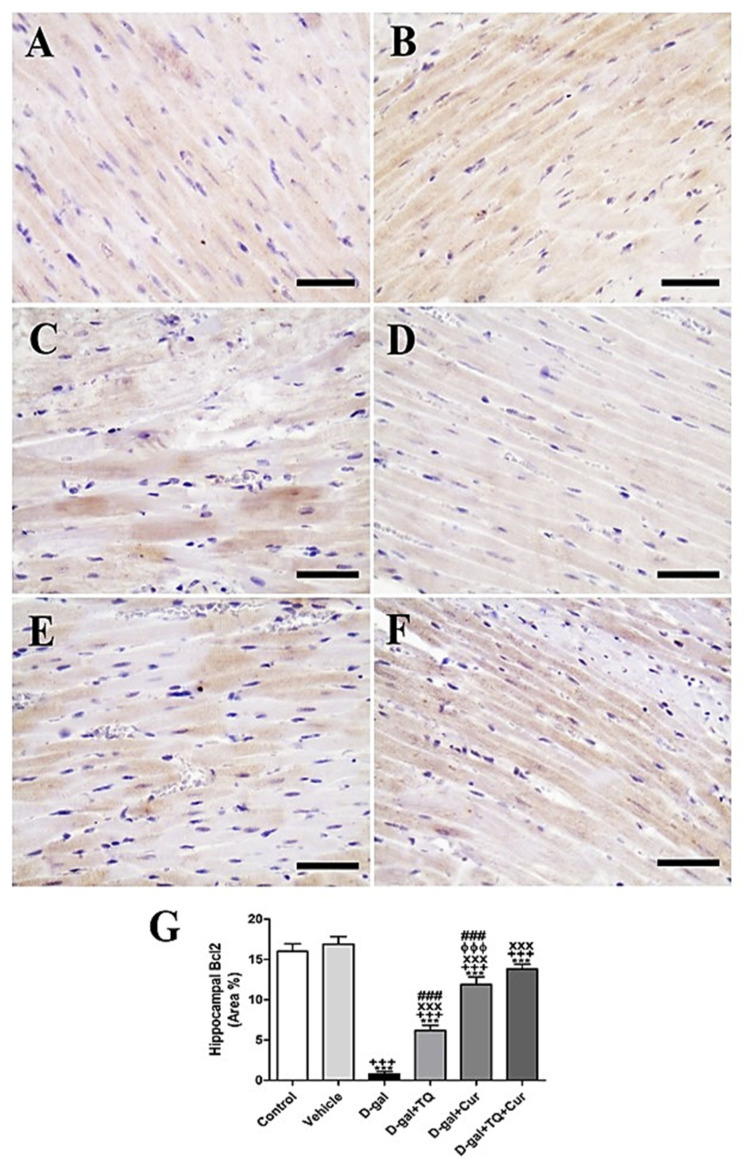
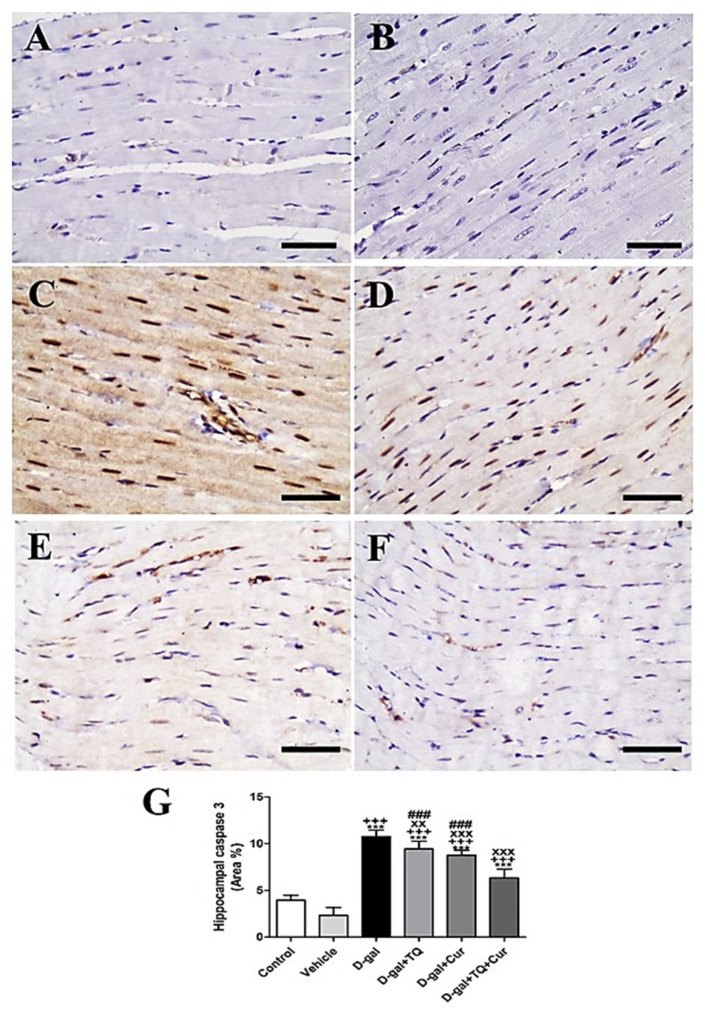
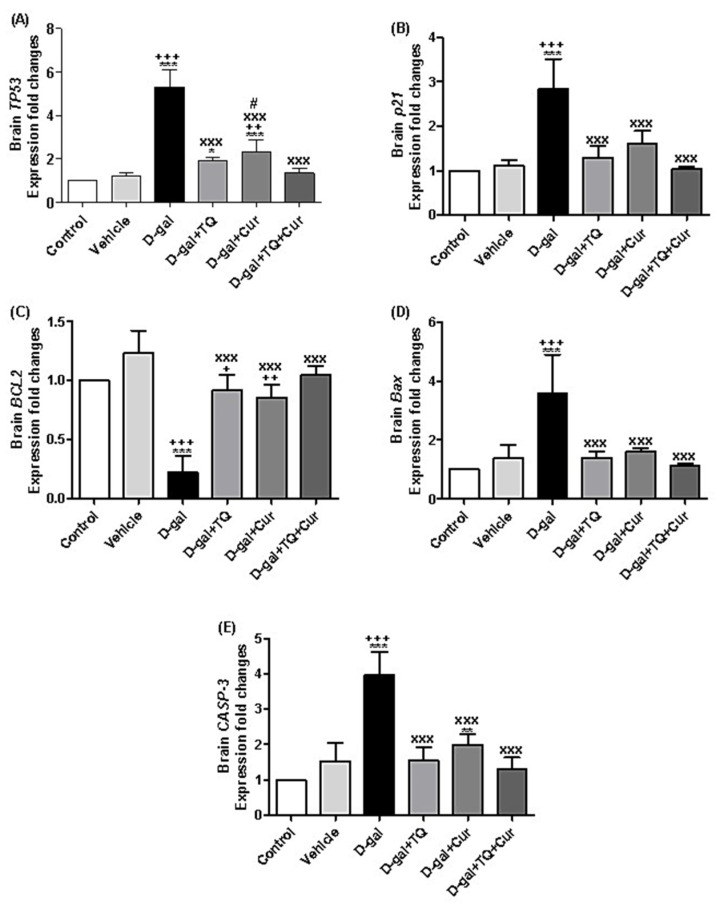
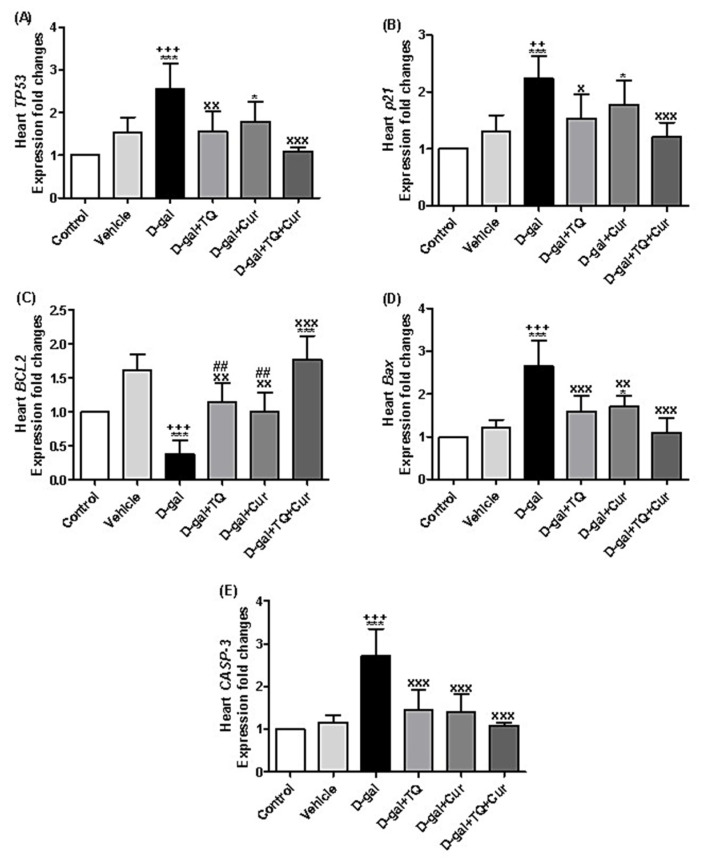
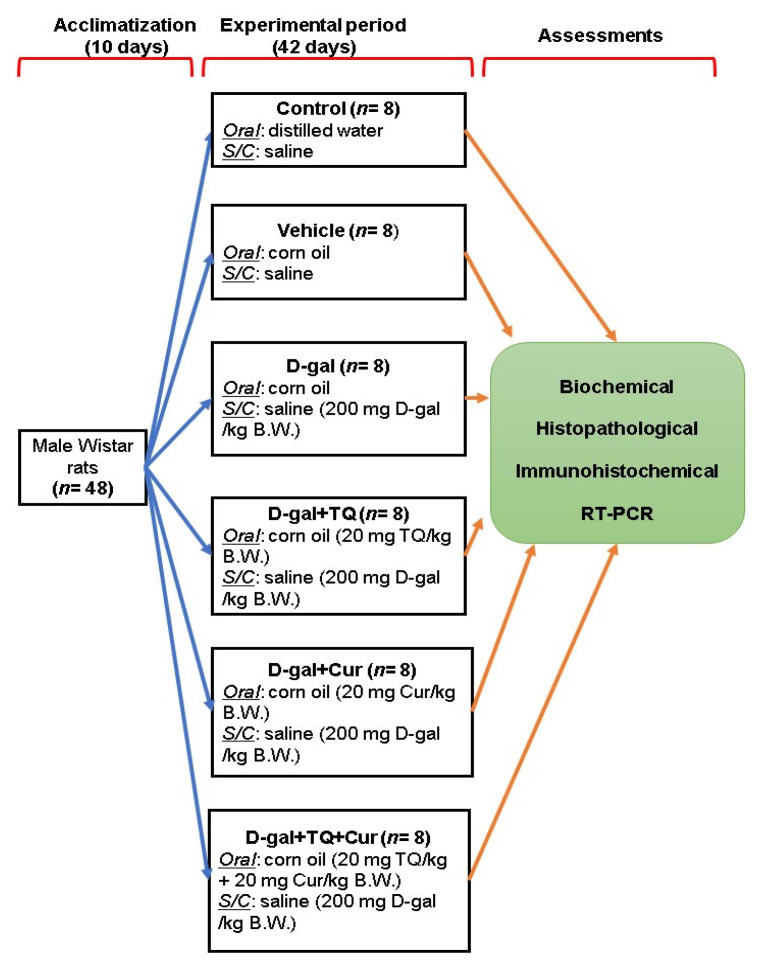
D-galactose (D-gal) administration causes oxidative disorder and is widely utilized in aging animal models. Therefore, we subcutaneously injected D-gal at 200 mg/kg BW dose to assess the potential preventive effect of thymoquinone (TQ) and curcumin (Cur) against the oxidative alterations induced by D-gal. Other than the control, vehicle, and D-gal groups, the TQ and Cur treated groups were orally supplemented at 20 mg/kg BW of each alone or combined. TQ and Cur effectively suppressed the oxidative alterations induced by D-gal in brain and heart tissues. The TQ and Cur combination significantly decreased the elevated necrosis in the brain and heart by D-gal. It significantly reduced brain caspase 3, calbindin, and calcium-binding adapter molecule 1 (IBA1), heart caspase 3, and BCL2. Expression of mRNA of the brain and heart TP53, p21, Bax, and CASP-3 were significantly downregulated in the TQ and Cur combination group along with upregulation of BCL2 in comparison with the D-gal group. Data suggested that the TQ and Cur combination is a promising approach in aging prevention.
Keywords: D-galactose; anti-aging; curcumin; oxidative stress; thymoquinone.
Conflict of interest statement
The authors declare no conflict of interest.
Figures
Similar articles
-
Evaluation of the effect of thymoquinone in d-galactose-induced memory impairments in rats: Role of MAPK, oxidative stress, and neuroinflammation pathways and telomere length.Phytother Res. 2021 Apr;35(4):2252-2266. doi: 10.1002/ptr.6982. Epub 2020 Dec 16. Phytother Res. 2021. PMID: 33325602
-
Thymoquinone and curcumin combination protects cisplatin-induced kidney injury, nephrotoxicity by attenuating NFκB, KIM-1 and ameliorating Nrf2/HO-1 signalling.J Drug Target. 2020 Nov;28(9):913-922. doi: 10.1080/1061186X.2020.1722136. Epub 2020 Feb 5. J Drug Target. 2020. PMID: 31983246
-
Curcumin protects against aging-related stress and dysfunction through autophagy activation in rat brain.Mol Biol Rep. 2024 May 25;51(1):694. doi: 10.1007/s11033-024-09639-7. Mol Biol Rep. 2024. PMID: 38796662
-
Arthrospira platensis Nanoparticles Mitigate Aging-Related Oxidative Injured Brain Induced by D-galactose in Rats Through Antioxidants, Anti-Inflammatory, and MAPK Pathways.Int J Nanomedicine. 2023 Oct 2;18:5591-5606. doi: 10.2147/IJN.S416202. eCollection 2023. Int J Nanomedicine. 2023. PMID: 37808455 Free PMC article.
-
In vitro study of the cytotoxicity of thymoquinone/curcumin fluorescent liposomes.Naunyn Schmiedebergs Arch Pharmacol. 2019 Nov;392(11):1465-1476. doi: 10.1007/s00210-019-01688-1. Epub 2019 Aug 3. Naunyn Schmiedebergs Arch Pharmacol. 2019. PMID: 31377882
Cited by
-
Curcumin Attenuates Ferroptosis-Induced Myocardial Injury in Diabetic Cardiomyopathy through the Nrf2 Pathway.Cardiovasc Ther. 2022 Jul 15;2022:3159717. doi: 10.1155/2022/3159717. eCollection 2022. Cardiovasc Ther. 2022. PMID: 35909950 Free PMC article.
-
Thymoquinone attenuates diabetes-induced hepatic damage in rat via regulation of oxidative/nitrosative stress, apoptosis, and inflammatory cascade with molecular docking approach.Sci Rep. 2024 Jun 6;14(1):13016. doi: 10.1038/s41598-024-62780-y. Sci Rep. 2024. PMID: 38844763 Free PMC article.
-
Chronic Oral D-Galactose Induces Oxidative Stress but Not Overt Organ Dysfunction in Male Wistar Rats.Curr Issues Mol Biol. 2025 Feb 27;47(3):161. doi: 10.3390/cimb47030161. Curr Issues Mol Biol. 2025. PMID: 40136415 Free PMC article.
-
Curcumin attenuates myocardial ischemia‑reperfusion‑induced autophagy‑dependent ferroptosis via Sirt1/AKT/FoxO3a signaling.Int J Mol Med. 2025 Mar;55(3):51. doi: 10.3892/ijmm.2025.5492. Epub 2025 Jan 24. Int J Mol Med. 2025. PMID: 39930816 Free PMC article.
-
Natural Products and Neuroprotection 3.0.Int J Mol Sci. 2023 Feb 15;24(4):3885. doi: 10.3390/ijms24043885. Int J Mol Sci. 2023. PMID: 36835303 Free PMC article.
References
-
- Zhao F., Zhou Y., Gao L., Qin X., Du G. [Advances in the study of the rat model of aging induced by D-galactose] Yao Xue Xue Bao. 2017;52:347–354. - PubMed
Publication types
MeSH terms
Substances
LinkOut - more resources
Full Text Sources
Research Materials
Miscellaneous
