

Plasmid-Mediated Antibiotic Resistant Escherichia coli in Sarawak Rivers and Aquaculture Farms, Northwest of Borneo
- PMID: 34202216
- PMCID: PMC8300627
- DOI: 10.3390/antibiotics10070776
Plasmid-Mediated Antibiotic Resistant Escherichia coli in Sarawak Rivers and Aquaculture Farms, Northwest of Borneo
Abstract
Background: The emergence of plasmid-mediated antibiotic resistance in Escherichia coli in water resources could pose a serious threat to public health. The study aims to investigate the dispersion of plasmid-mediated antibiotic-resistant E. coli from six rivers in Sarawak and two aquaculture farms in Borneo.
Methods: A total of 74 water samples were collected for the determination of their bacteria colony count. An IMViC test identified 31 E. coli isolates and tested their susceptibility against twelve clinically important antibiotics. The extraction of plasmid DNA was done using alkali lysis SDS procedures. Characteristics, including plasmid copy number, molecular weight size, resistance rate and multiple antibiotic resistance (MAR), were assessed.
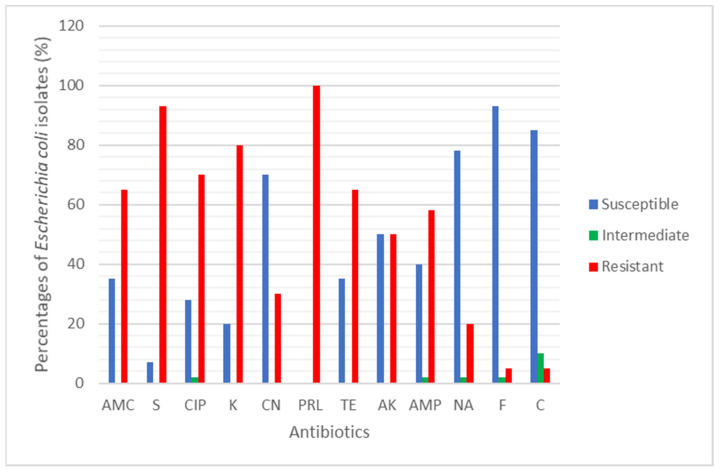
Results: Our findings revealed that bacterial counts in rivers and aquaculture farms ranged from log 2.00 to 3.68 CFU/mL and log 1.70 to 5.48 cfu/mL, respectively. Resistance to piperacillin (100%) was observed in all E. coli; resistance to amoxicillin (100%) and ampicillin (100%) was observed in E. coli found in aquaculture farms; resistance to streptomycin (93%) was observed in E. coli found in rivers. All E. coli were resistant to ≥2 antibiotics and formed 26 MAR profiles, ranging from an index of 0.17 to 0.83, indicating that there are high risks of contamination. Some (48.4%) of the E. coli were detected with plasmids (1.2 to >10 kb), whereas 51.6% of the E. coli did not harbor any plasmids. The plasmid copy numbers reported were one plasmid (n = 7), two plasmids (n = 4), ≥ two plasmids (4). E. coli isolated from the Muara Tuang River showed the highest-molecular-weight plasmids. A statistical analysis revealed that there is no significant correlation (r = 0.21, p = 0.253) between the number of plasmids and the MAR index of the tested isolates.
Conclusion: The distribution of MAR in E. coli from rivers is higher compared to the aquaculture environment. Our study suggests that MAR in isolates could be chromosome-mediated. Our results suggest that riverbed sediments could serve as reservoirs for MAR bacteria, including pathogens, under different climatic conditions, and their analysis could provide information for public health concerns.
Keywords: Escherichia coli; aquaculture; drug resistant; extrachromosomal; plasmid; water source.
Conflict of interest statement
The authors declare no conflict of interest. The funders had no role in the design of the study; in the collection, analyses, or interpretation of data; in the writing of the manuscript, or in the decision to publish the results.
Figures


Similar articles
-
High prevalence of multiple-antibiotic-resistant (MAR) Escherichia coli in river bed sediments of the Apies River, South Africa.Environ Monit Assess. 2015 Oct;187(10):652. doi: 10.1007/s10661-015-4879-6. Epub 2015 Sep 30. Environ Monit Assess. 2015. PMID: 26419380
-
Antibiotic Resistance of Diverse Bacteria from Aquaculture in Borneo.Int J Microbiol. 2016;2016:2164761. doi: 10.1155/2016/2164761. Epub 2016 Sep 25. Int J Microbiol. 2016. PMID: 27746817 Free PMC article.
-
Determination of microbial quality and plasmid-mediated multidrug resistant bacteria in fountain drinking water sources in Turkey.J Environ Biol. 2012 Nov;33(6):1127-36. J Environ Biol. 2012. PMID: 23741812
-
[Distribution and diversity of conjugative plasmids among some multiple antibiotic resistant E.coli strains isolated from river waters].Bacteriol Virusol Parazitol Epidemiol. 2002 Jul-Dec;47(3-4):147-53. Bacteriol Virusol Parazitol Epidemiol. 2002. PMID: 15085604 Romanian.
-
High Prevalence of Plasmid-Mediated Quinolone Resistance and IncQ Plasmids Carrying qnrS2 Gene in Bacteria from Rivers near Hospitals and Aquaculture in China.PLoS One. 2016 Jul 18;11(7):e0159418. doi: 10.1371/journal.pone.0159418. eCollection 2016. PLoS One. 2016. PMID: 27427763 Free PMC article.
Cited by
-
Escherichia coli as a sentinel in the assessment of antimicrobial resistance in the tilapia production chain: from production environment to the final product.Front Antibiot. 2024 Oct 22;3:1461662. doi: 10.3389/frabi.2024.1461662. eCollection 2024. Front Antibiot. 2024. PMID: 39816247 Free PMC article.
-
A Newly Incompatibility F Replicon Allele (FIB81) in Extensively Drug-Resistant Escherichia coli Isolated from Diseased Broilers.Int J Mol Sci. 2024 Jul 30;25(15):8347. doi: 10.3390/ijms25158347. Int J Mol Sci. 2024. PMID: 39125914 Free PMC article.
-
Antimicrobial Resistance of Escherichia coli From Aquaculture Farms and Their Environment in Zhanjiang, China.Front Vet Sci. 2021 Dec 24;8:806653. doi: 10.3389/fvets.2021.806653. eCollection 2021. Front Vet Sci. 2021. PMID: 35004933 Free PMC article.
References
-
- Food and Agriculture Organization of the United Nations (FAO) The State of World Fisheries and Aquaculture 2018. [(accessed on 13 January 2021)]; Available online: http://www.fao.org/3/i9540en/i9540en.pdf.
-
- Lien L., Hoa N., Chuc N., Thoa N., Phuc H., Diwan V., Dat N., Tamhankar A., Lundborg C. Antibiotics in wastewater of a rural and an urban hospital before and after wastewater treatment, and the relationship with antibiotic use-A one year study from Vietnam. Int. J. Environ. Res. Public Health. 2016;13:588. doi: 10.3390/ijerph13060588. - DOI - PMC - PubMed
-
- Conte D., Palmeiro J.K., da Silva Nogueira K., de Lima T.M.R., Cardoso M.A., Pontarolo R., Degaut Pontes F.L., Dalla-Costa L.M. Characterization of CTX-M enzymes, quinolone resistance determinants, and antimicrobial residues from hospital sewage, wastewater treatment plant, and river water. Ecotoxicol. Environ. Saf. 2017;136:62–69. doi: 10.1016/j.ecoenv.2016.10.031. - DOI - PubMed
Grants and funding
LinkOut - more resources
Full Text Sources
