

Vaccine Effects on Susceptibility and Symptomatology Can Change the Optimal Allocation of COVID-19 Vaccines: South Korea as an Example
- PMID: 34202324
- PMCID: PMC8268243
- DOI: 10.3390/jcm10132813
Vaccine Effects on Susceptibility and Symptomatology Can Change the Optimal Allocation of COVID-19 Vaccines: South Korea as an Example
Abstract
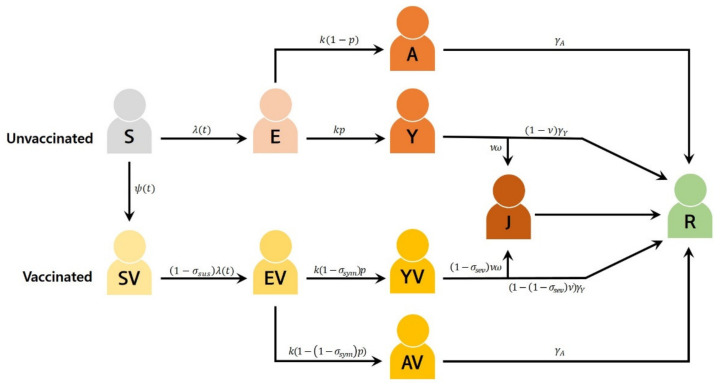
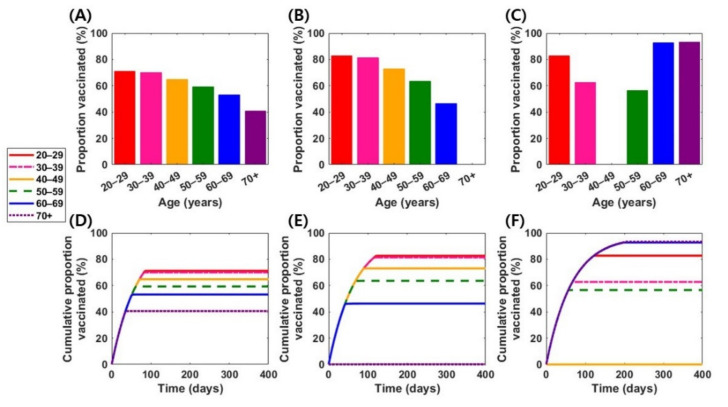
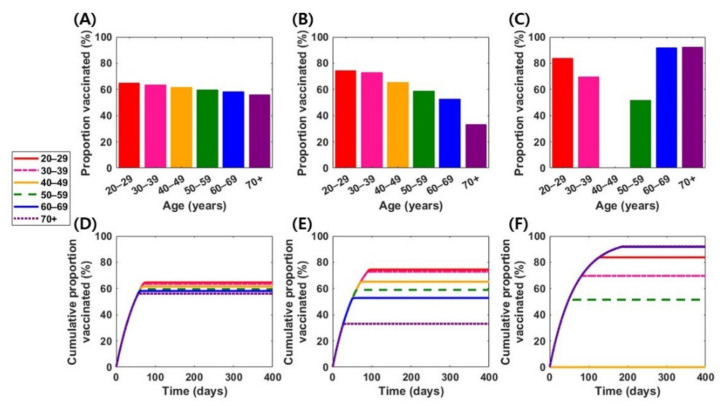
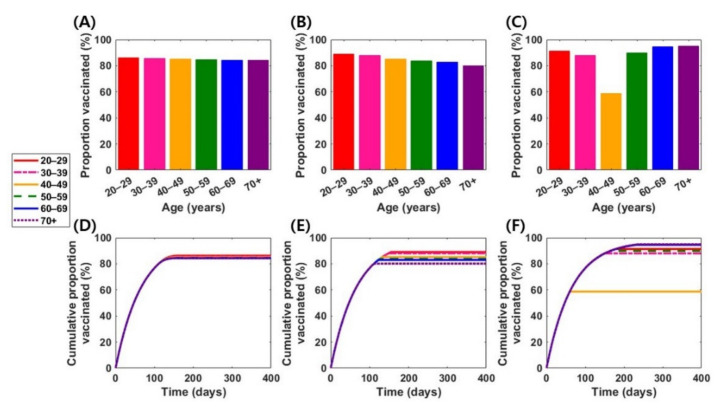
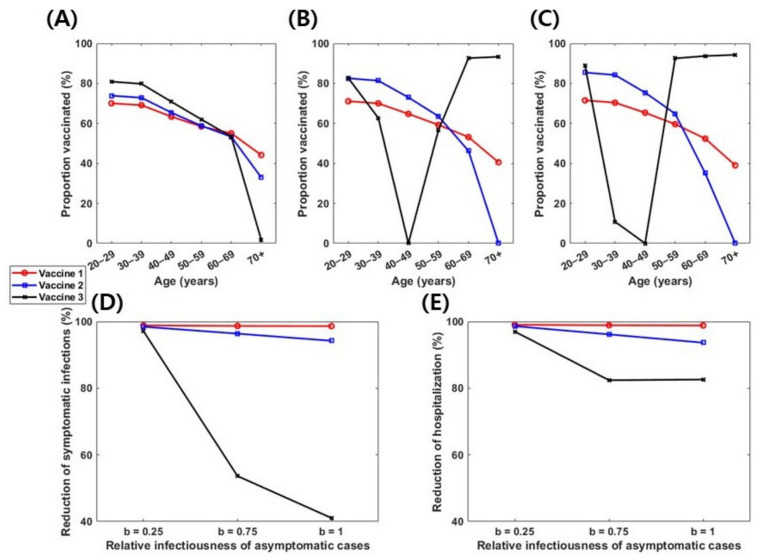
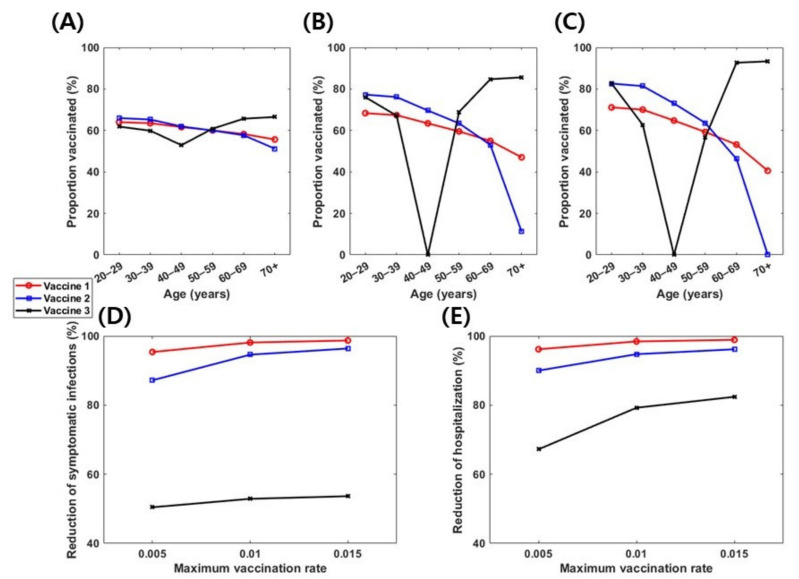
The approved coronavirus disease (COVID-19) vaccines reduce the risk of disease by 70-95%; however, their efficacy in preventing COVID-19 is unclear. Moreover, the limited vaccine supply raises questions on how they can be used effectively. To examine the optimal allocation of COVID-19 vaccines in South Korea, we constructed an age-structured mathematical model, calibrated using country-specific demographic and epidemiological data. The optimal control problem was formulated with the aim of finding time-dependent age-specific optimal vaccination strategies to minimize costs related to COVID-19 infections and vaccination, considering a limited vaccine supply and various vaccine effects on susceptibility and symptomatology. Our results suggest that "susceptibility-reducing" vaccines should be relatively evenly distributed among all age groups, resulting in more than 40% of eligible age groups being vaccinated. In contrast, "symptom-reducing" vaccines should be administered mainly to individuals aged 20-29 and ≥60 years. Thus, our study suggests that the vaccine profile should determine the optimal vaccination strategy. Our findings highlight the importance of understanding vaccine's effects on susceptibility and symptomatology for effective public health interventions.
Keywords: COVID-19; mathematical model; optimal control theory; vaccination; vaccine efficacy.
Conflict of interest statement
The author declares no conflict of interest. The funders had no role in the design of the study; in the collection, analyses, or interpretation of data; in the writing of the manuscript, or in the decision to publish the results.
Figures
Similar articles
-
Optimal Allocation of the Limited COVID-19 Vaccine Supply in South Korea.J Clin Med. 2021 Feb 4;10(4):591. doi: 10.3390/jcm10040591. J Clin Med. 2021. PMID: 33557344 Free PMC article.
-
Comparing COVID-19 vaccine allocation strategies in India: A mathematical modelling study.Int J Infect Dis. 2021 Feb;103:431-438. doi: 10.1016/j.ijid.2020.12.075. Epub 2020 Dec 31. Int J Infect Dis. 2021. PMID: 33388436 Free PMC article.
-
Developing a Framework for Pandemic COVID-19 Vaccine Allocation: a Modified Delphi Consensus Study in Korea.J Korean Med Sci. 2021 Jun 14;36(23):e166. doi: 10.3346/jkms.2021.36.e166. J Korean Med Sci. 2021. PMID: 34128597 Free PMC article.
-
Influenza virus vaccine live intranasal--MedImmune vaccines: CAIV-T, influenza vaccine live intranasal.Drugs R D. 2003;4(5):312-9. doi: 10.2165/00126839-200304050-00007. Drugs R D. 2003. PMID: 12952502 Review.
-
Allergic reactions to Japanese encephalitis vaccine.Immunol Allergy Clin North Am. 2003 Nov;23(4):665-97. doi: 10.1016/s0889-8561(03)00102-4. Immunol Allergy Clin North Am. 2003. PMID: 14753386 Review.
Cited by
-
Predictive models for health outcomes due to SARS-CoV-2, including the effect of vaccination: a systematic review.Syst Rev. 2024 Jan 16;13(1):30. doi: 10.1186/s13643-023-02411-1. Syst Rev. 2024. PMID: 38229123 Free PMC article.
-
Learning from the COVID-19 pandemic: A systematic review of mathematical vaccine prioritization models.Infect Dis Model. 2024 May 15;9(4):1057-1080. doi: 10.1016/j.idm.2024.05.005. eCollection 2024 Dec. Infect Dis Model. 2024. PMID: 38988830 Free PMC article. Review.
-
Learning from the COVID-19 pandemic: a systematic review of mathematical vaccine prioritization models.medRxiv [Preprint]. 2024 Mar 7:2024.03.04.24303726. doi: 10.1101/2024.03.04.24303726. medRxiv. 2024. Update in: Infect Dis Model. 2024 May 15;9(4):1057-1080. doi: 10.1016/j.idm.2024.05.005. PMID: 38496570 Free PMC article. Updated. Preprint.
References
-
- WHO . Coronavirus disease 2019 (COVID-19): Situation Report. WHO; Geneva, Switzerland: 2020.
-
- KDCA . The Updates of COVID-19 in Republic of Korea. Korea Disease Control and Prevention Agency; Cheongju, Korea: 2021.
-
- Corey L., Mascola J.R., Fauci A.S., Collins F.S. A strategic approach to COVID-19 vaccine R&D. Science. 2020;368:948–950. - PubMed
Grants and funding
LinkOut - more resources
Full Text Sources
