. 2021 Jun 24;11(7):935.
doi: 10.3390/biom11070935.

The Role of Cholesterol in Amyloidogenic Substrate Binding to the γ-Secretase Complex

Affiliations

The Role of Cholesterol in Amyloidogenic Substrate Binding to the γ-Secretase Complex

Urszula Orzeł et al. Biomolecules. .

Abstract

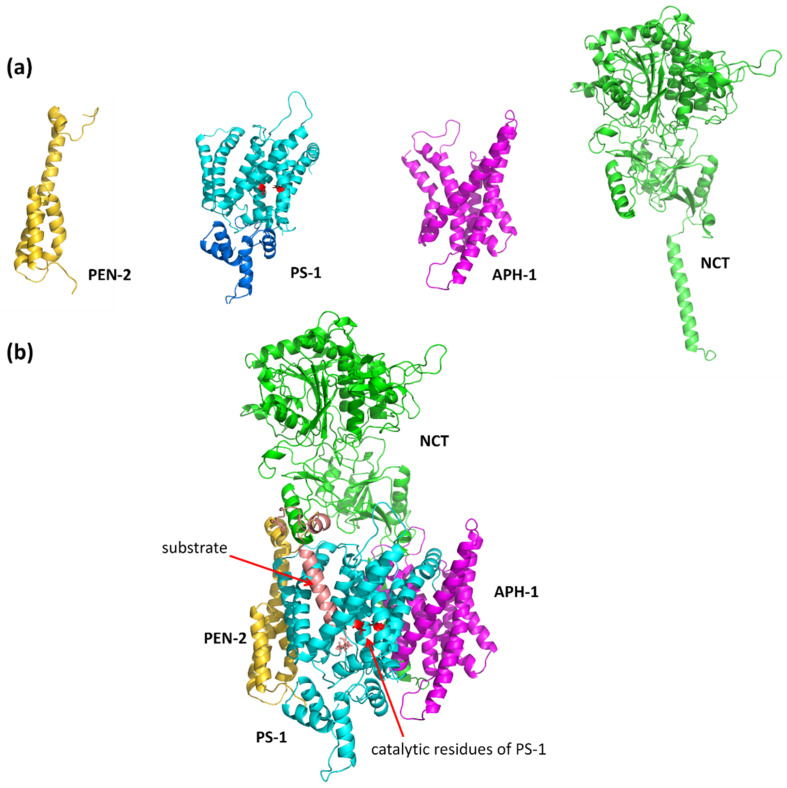
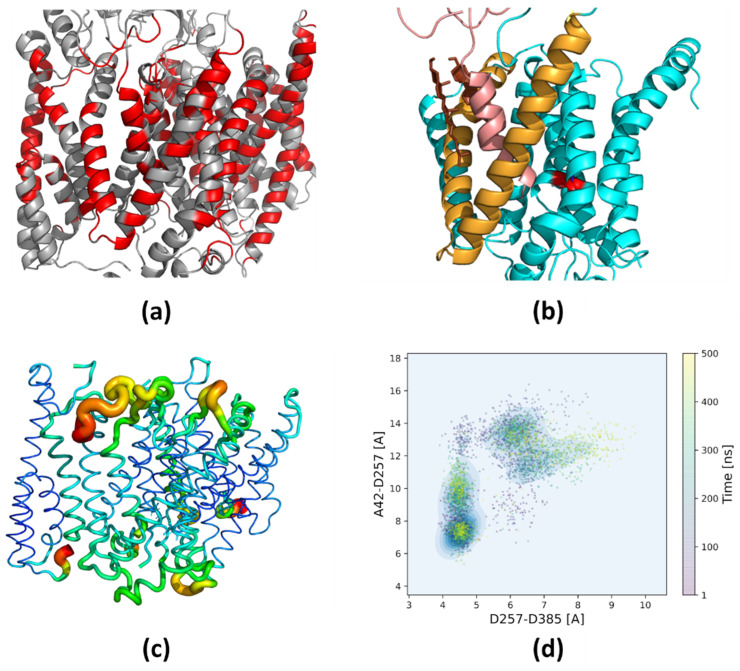
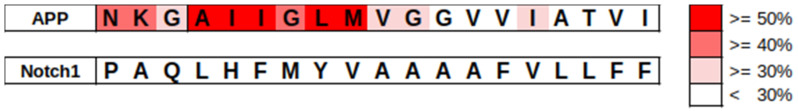
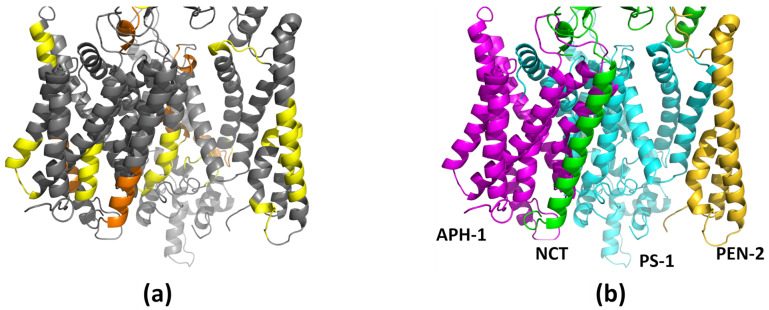
Alzheimer's disease is the most common progressive neurodegenerative disorder and is characterized by the presence of amyloid β (Aβ) plaques in the brain. The γ-secretase complex, which produces Aβ, is an intramembrane-cleaving protease consisting of four membrane proteins. In this paper we investigated the amyloidogenic fragments of amyloid precursor protein (substrates Aβ43 and Aβ45, leading to less amyloidogenic Aβ40 and more amyloidogenic Aβ42, respectively) docked to the binding site of presenilin, the catalytic subunit of γ-secretase. In total, we performed 9 μs of all-atom molecular dynamics simulations of the whole γ-secretase complex with both substrates in low (10%) and high (50%) concentrations of cholesterol in the membrane. We found that, at the high cholesterol level, the Aβ45 helix was statistically more flexible in the binding site of presenilin than Aβ43. An increase in the cholesterol concentration was also correlated with a higher flexibility of the Aβ45 helix, which suggests incompatibility between Aβ45 and the binding site of presenilin potentiated by a high cholesterol level. However, at the C-terminal part of Aβ45, the active site of presenilin was more compact in the case of a high cholesterol level, which could promote processing of this substrate. We also performed detailed mapping of the cholesterol binding sites at low and high cholesterol concentrations, which were independent of the typical cholesterol binding motifs.

Keywords: Alzheimer’s disease; amyloid precursor protein; cholesterol; membrane proteolysis; γ-secretase complex.


Conflict of interest statement

The authors declare no conflict of interest. The funders had no role in the design of the study; in the collection, analyses, or interpretation of data; in the writing of the manuscript; or in the decision to publish the results.

Figures

Figure 1
Figure 1
(a) The nonamyloidogenic (after α-secretase cleavage) and amyloidogenic (after β-secretase cleavage) pathways of amyloid precursor protein (APP); (b) the sequence multiple alignment of selected substrates and products of APP. At the bottom of the figure, the Aβ42 sequence is shown, including the sAβ42 sequence marked in violet.
Figure 2
Figure 2
The structure of γ-secretase. (a) The individual components of the complex. PS-1 is shown with the modeled long cytosolic loop (residues 288–378, colored in blue) located between helices TM6 and TM7 that contains catalytic residues. The catalytic residues are shown in red. (b) The whole complex of γ-secretase together with docked substrate Aβ. Colors of proteins: PS-1 in cyan, APH-1 in purple, NCT in green, PEN-2 in yellow, and the Aβ substrate in salmon.
Figure 3
Figure 3
An illustration of the most important findings described in the paper. (a) Detailed map of the cholesterol binding sites; (b) repositioning of the substrate by its direct contact with cholesterol, preventing the bending of PS-1 helix; (c) differences in flexibility of the substrates in the binding site of PS-1, especially at a high level of cholesterol; (d) differences between substrates in terms of the compacting of the active site.
Figure 4
Figure 4
Position of the γ-secretase complex in the membrane and its average thickness taken from MD simulations. The same structure of the complex is shown in both panels for better visualization of its position. (a) The regular POPC membrane with 10% cholesterol and disordered lipid chains; (b) the raft-like bilayer with 50% cholesterol and nearly parallel lipid chains is on average 4 Å thicker.
Figure 5
Figure 5
Location of areas of γ-secretase complex interacting with cholesterol molecules—the aggregated data from all simulations. Rotations of structure about 120° in each row; (a) 50% cholesterol, (b) the reference structure with the same rotations showing each molecule in separate color: PS-1 in blue, APH-1 in purple, nicastrin in green, PEN-2 in yellow, substrate in red; (c) 10% cholesterol. The bars on the left show the scale: the percentage of time during MD simulations of that particular residue being in contact with cholesterol.
Figure 6
Figure 6
The presence of two cholesterol molecules (in brown) in the substrate binding site of PS-1 (in cyan) with extensive contacts with the substrate helix (in salmon) in the membrane with a high concentration of cholesterol. Helices TM2 and TM3 of PS-1, forming a triangle, are colored gold. The kink of TM3 is most visible in the left panel. The catalytic residues are shown in red. (a) Side view of the PS-1–substrate complex; (b) front view of the PS-1–substrate complex.
Figure 7
Figure 7
The sequence alignment of amyloid substrates (indicated as APP) in contact with cholesterol with the corresponding Notch1 sequence. The particular residues of substrates in contact with cholesterol are marked on the APP sequence in shades of red. The percentage values are averaged over all MD simulations with a 50% cholesterol concentration, and the color scale is shown on the right.
Figure 8
Figure 8
Location of the cholesterol binding motifs in γ-secretase. Only the membranous part of the complex is shown. (a) The cholesterol binding motifs CRAC (orange) and CARC (yellow); (b) the same orientation of γ-secretase with colored subunits is shown as a reference structure. The scheme of colors is the same as in Figure 2.
Figure 9
Figure 9
Root-mean-square fluctuations (RMSF) of particular residues of γ-secretase mapped on its 3D structure. The circled area of four panels contains the RMSF values coded by the color and size of backbone tube. Each central panel is an average of four simulations. The small RMSF values are in blue and higher ones are in green, yellow, and red. Only the membrane part of the complex is shown since the high RMSF values of flexible loops would mask much smaller fluctuations of the membrane part. (a) Differences in fluctuations between 50% and 10% cholesterol for the γ-secretase complex with Aβ43; (b) the same for Aβ45; (c) differences between fluctuations of the γ-secretase complex with Aβ45 and Aβ43 in membrane with 10% cholesterol; (d) the same for 50% cholesterol. Blue and orange arrows indicate the increased flexibility of the Aβ45 helix. Colors for RMSF differences are red for positive and blue for negative. For comparison purposes, the γ-secretase complexes are depicted in the left panels. The scheme of colors is the same as in Figure 2.
Figure 10
Figure 10
Comparison of cryo-EM structure (PDB id: 6IYC) with bound APP-C83 (purple helix and β-thread) with structures of Aβ peptides from exemplary MD simulations (helix in salmon). Olive and brown balls indicate the positions of the same residue to show possible rotations and movements of Aβ43/Aβ45 (olive) compared with APP-C83 (brown). (a) Superimposition of PS-1 with APP-C83 substrate and PS-1 with docked Aβ43 substrate after MD simulation of the γ-secretase complex in 10% cholesterol membrane; (b) the same in 50% cholesterol membrane; (c) superimposition of PS-1 with APP-C83 substrate and PS-1 with docked Aβ45 substrate after MD simulation of the γ-secretase complex in 10% cholesterol membrane; (d) the same in 50% cholesterol membrane.
Figure 11
Figure 11
Bending of TM3 of PS-1 in low and high cholesterol concentrations in exemplary simulations. Helices TM2 and TM3 are in close contact with the substrate helix, and their positions can directly influence the position of the substrate at the binding site. (a) Bending angles at residues of TM3 PS-1 with Aβ45 substrate in 10% cholesterol membrane; (b) the same in 50% cholesterol membrane; (c) bending angles at residues of TM3 PS-1 with Aβ43 substrate in 10% cholesterol membrane; (d) the same in 50% cholesterol membrane.
Figure 12
Figure 12
The average secondary structure of the substrate Aβ43 and Aβ45 during MD simulations in 10% and 50% of cholesterol. Each panel is an average of four MD simulations. (a) Aβ43 substrate in 10% cholesterol membrane; (b) the same in 50% cholesterol membrane; (c) Aβ45 substrate in 10% cholesterol membrane; (d) the same in 50% cholesterol membrane.
Figure 13
Figure 13
2D scatter plots showing distances between catalytic residues (horizontal axes) and distances between one of the catalytic residue (D257) and the peptide bond that is to be cleaved (vertical axes). Each panel is the average of four MD simulations. All simulations for each type of the system (Aβ43/Aβ45 and high/low cholesterol) were added to the grouping frames at the same time of simulation. All points are colored by the time of MD simulation from purple (0 ns) to yellow (500 ns). (a) MD simulations of γ-secretase complex with Aβ43 substrate in 10% cholesterol membrane; (b) the same in 50% cholesterol membrane; (c) MD simulations of γ-secretase complex with Aβ45 substrate in 10% cholesterol membrane; (d) the same in 50% cholesterol membrane.

References

    1. Pensalfini A., Albay R., III, Rasool S., Wu J.W., Hatami A., Arai H., Margol L., Milton S., Poon W.W., Corrada M.M., et al. Intracellular amyloid and the neuronal origin of Alzheimer neuritic plaques. Neurobiol. Dis. 2014;71:53–61. doi: 10.1016/j.nbd.2014.07.011. - DOI - PMC - PubMed
    1. Steiner H., Fukumori A., Tagami S., Okochi M. Making the final cut: Pathogenic amyloid-beta peptide generation by gamma-secretase. Cell Stress. 2018;2:292–310. doi: 10.15698/cst2018.11.162. - DOI - PMC - PubMed
    1. Becker R.E., Greig N.H., Giacobini E., Schneider L.S., Ferrucci L. A new roadmap for drug development for Alzheimer’s disease. Nat. Rev. Drug Discov. 2014;13:156. doi: 10.1038/nrd3842-c2. - DOI - PMC - PubMed
    1. Lao K., Ji N., Zhang X., Qiao W., Tang Z., Gou X. Drug development for Alzheimer’s disease: Review. J. Drug Target. 2019;27:164–173. doi: 10.1080/1061186X.2018.1474361. - DOI - PubMed
    1. Lichtenthaler S.F., Haass C., Steiner H. Regulated intramembrane proteolysis--lessons from amyloid precursor protein processing. J. Neurochem. 2011;117:779–796. doi: 10.1111/j.1471-4159.2011.07248.x. - DOI - PubMed

Publication types

MeSH terms