. 2021 Jun 24;11(7):594.
doi: 10.3390/jpm11070594.

Acquisition of New Migratory Properties by Highly Differentiated CD4+CD28null T Lymphocytes in Rheumatoid Arthritis Disease

Affiliations

Acquisition of New Migratory Properties by Highly Differentiated CD4+CD28null T Lymphocytes in Rheumatoid Arthritis Disease

Beatriz Rioseras et al. J Pers Med. .

Abstract

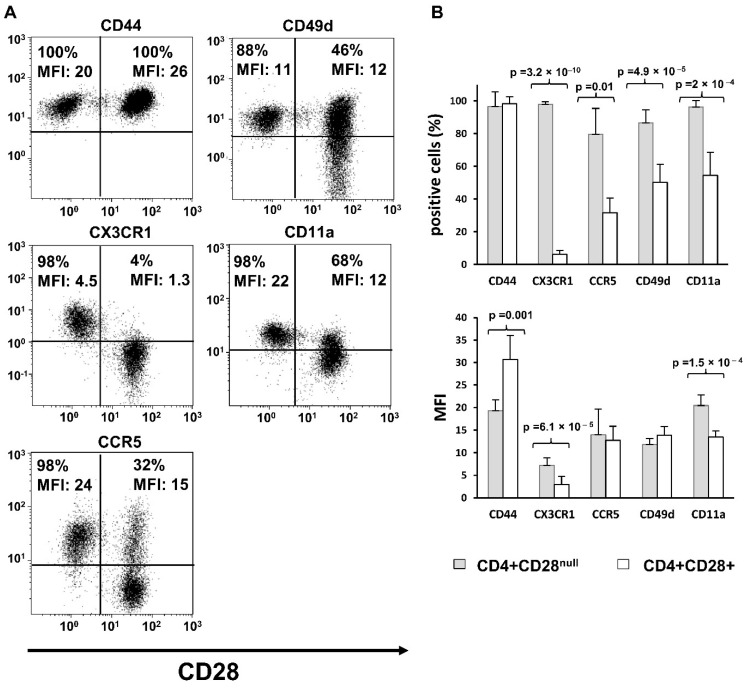
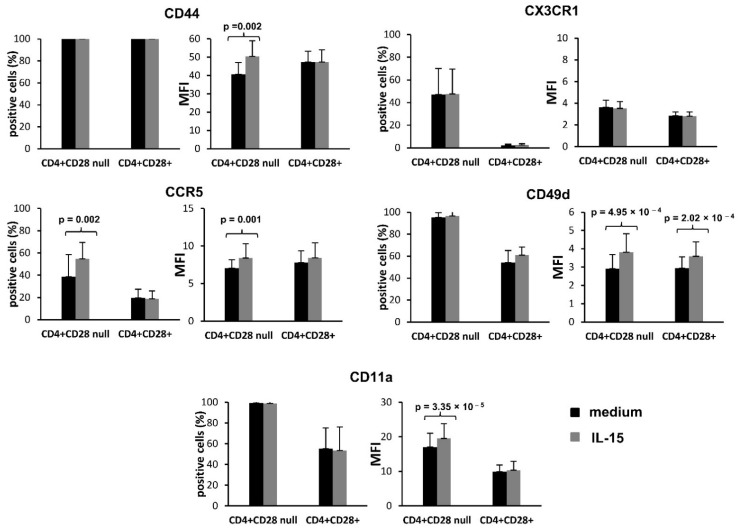
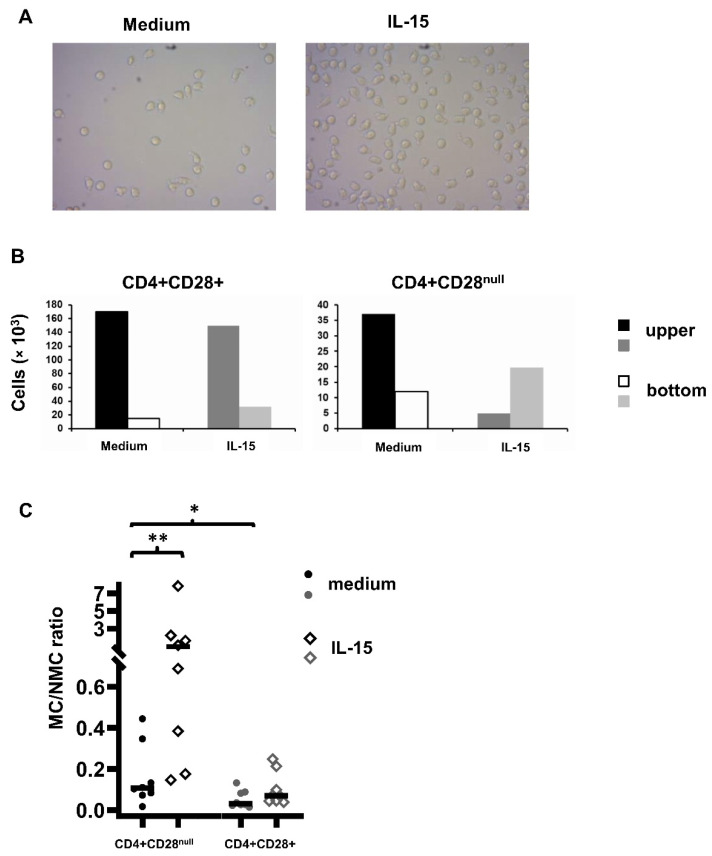
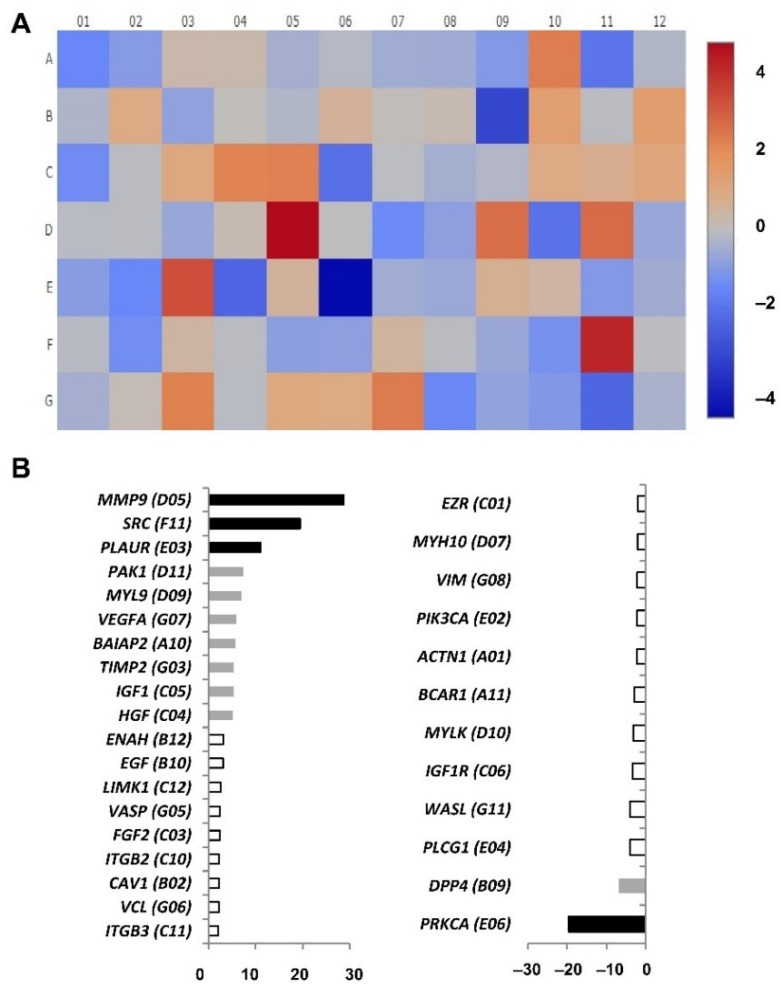
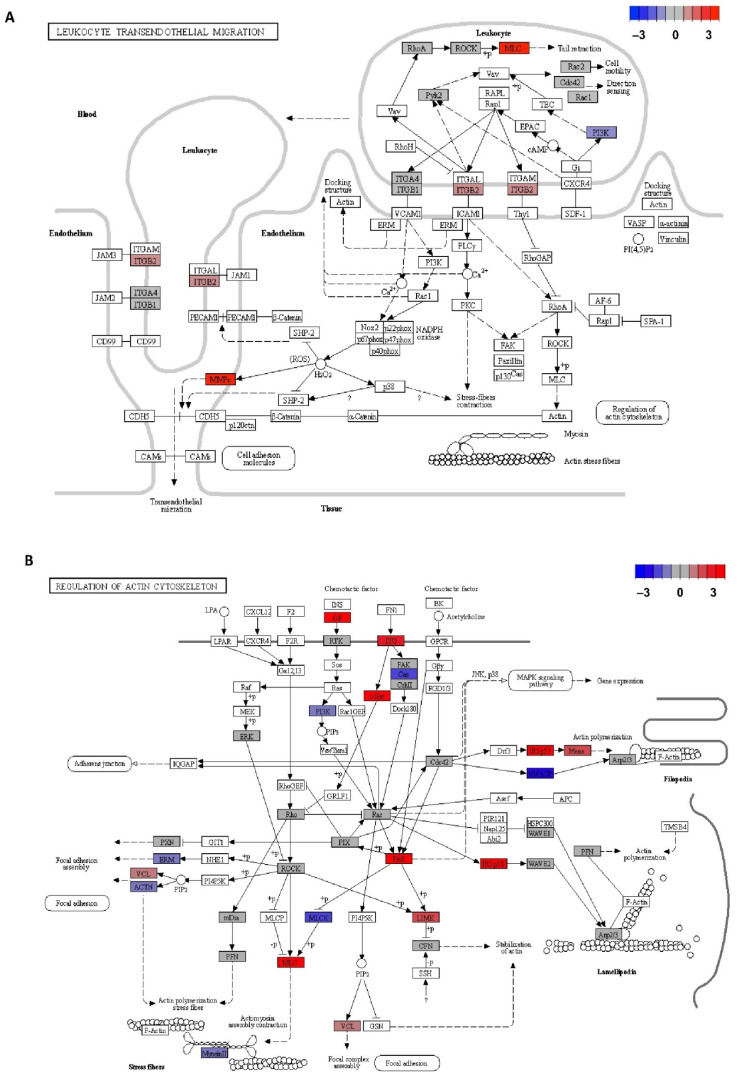
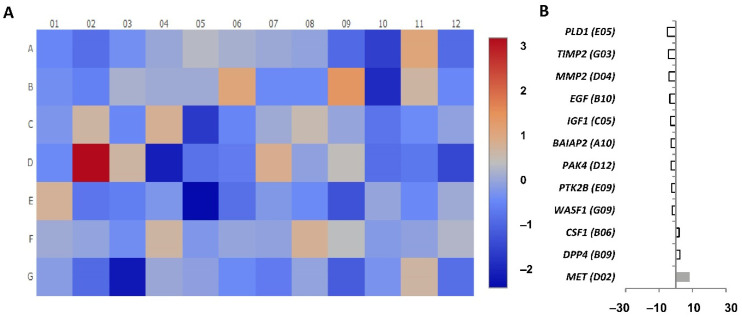
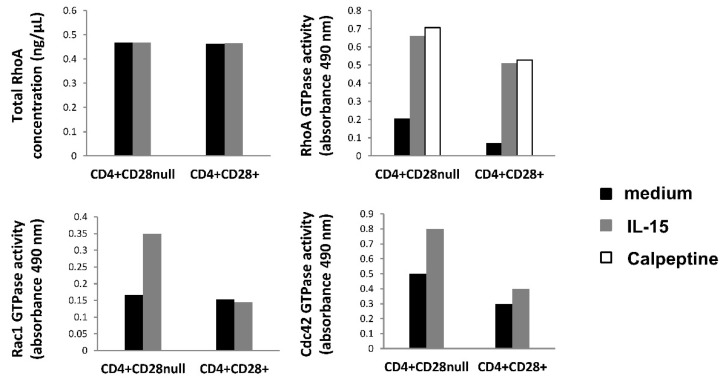
Expanded CD4+CD28null T lymphocytes are found in the tissues and peripheral blood of patients with many autoimmune diseases, such as rheumatoid arthritis (RA). These highly differentiated cells present potent inflammatory activity and capability to induce tissue destruction, which has been suggested to predispose to the development of more aggressive disease. In fact, preferential migration to inflammatory sites has been proposed to be a contributing factor in the progression of autoimmune and cardiovascular diseases frequently found in these patients. The functional activity of CD4+CD28null T lymphocytes is largely dependent on interleukin 15 (IL-15), and this cytokine may also act as a selective attractor of these cells to local inflammatory infiltrates in damaged tissues. We have analysed, in RA patients, the migratory properties and transcriptional motility profile of CD4+CD28null T lymphocytes compared to their counterparts CD28+ T lymphocytes and the enhancing role of IL-15. Identification of the pathways involved in this process will allow us to design strategies directed to block effector functions that CD4+CD28null T lymphocytes have in the target tissue, which may represent therapeutic approaches in this immune disorder.

Keywords: CD4+CD28null T lymphocytes; IL-15; migration; rheumatoid arthritis.


Conflict of interest statement

The authors declare that the research was conducted in the absence of any commercial or financial relationships that could be construed as a potential conflict of interest.

Figures

Figure 1
Figure 1
Basal expression of adhesion molecules and chemokine receptors. Results are representative for peripheral blood of seven RA patients. Expression levels of CD44, CX3CR1, CCR5, CD49d, and CD11a were analysed in both CD4+CD28+ and CD4+CD28null T cells by flow cytometry. (A) Dot-plots show a representative experiment; CD28 stain is represented on the X axis. The percentage of positive cells and MFI for each molecule is displayed in the figure. (B) Histograms represent the percentage of positive cells and MFI (mean ± SD) in CD28+ and CD28null cells. Paired T tests were used to compare differences; significant differences are indicated on the panel.
Figure 2
Figure 2
Effect of IL-15 on the expression of migration-related proteins. The results are representative of 10 RA patients. Peripheral blood mononuclear cells were cultured for 18 h in the presence or absence of IL-15 (50 ng/mL). Expression levels of CX3CR1, CD44, CCR5, CD11a, and CD49d were analysed in CD4+CD28+ and CD4+CD28null T cells by flow cytometry. Histograms represent the percentage and MFI of positive cells (mean ± SD) in CD28+ and CD28null cells cultured in medium (black bars) and in the presence of IL-15 (grey bars). Paired T tests were used to compare differences; significant differences are indicated on the panel.
Figure 3
Figure 3
Transwell migration assay of CD4+ T lymphocytes in culture medium alone and in the presence of IL-15 (50 ng/mL) in 18 h culture. (A) CD4+ T lymphocytes in the lower compartment of a transwell system in culture medium alone and in culture medium plus IL-15. Photographs were taken with an inverted microscope at 100X after examining 10 different areas of each lower compartment in different experiments with similar results. (B) Representative experiment. Histograms represent the number of non-migrating cells (NMCs) and the number of migrating cells (MCs) in the presence or absence of IL-15. The NMCs are those that, after 18 h of incubation, have remained in the upper compartment of the transwell system, and the MCs are those that, after that time, have crossed the membrane and passed to the lower compartment of the transwell system. (C) Ratio between MCs and NMCs in the two conditions and at 18 h of culture. CD4+ T lymphocytes isolated from peripheral blood samples were deposited in the upper compartment, and in the lower compartments, culture medium alone or culture medium plus IL-15 was added. After the incubation time, the cells were labelled with anti-CD45RA (FITC), anti-CD28 (PE), and anti-CD4 (PerCP). The fraction of CD4+CD28+ and CD4+CD28null memory T lymphocytes was determined with Kaluza software; * shows significant differences between CD4+CD28+ and CD4+CD28nulll memory T lymphocytes (p = 0.044); ** shows significant differences between CD4+CD28null T lymphocytes cultured in medium and in the presence of IL-15 (p = 0.003).
Figure 4
Figure 4
Cell motility array results comparing CD4+CD28null T lymphocytes (test sample) with CD4+CD28+ T lymphocytes (control sample) testing the expression of 84 different genes. (A) Heatmap performed by calculating the log2 of the fold change for each gene. The figure represents the level of expression of each gene with a colour scale from dark red (more expression in CD4+CD28null) to dark blue (less expression in CD4+CD28null). (B) Representation of the genes with significant expression differences; upregulated genes on the left and downregulated genes on the right. Black bars represent the fold regulation of genes with an expression difference higher than 10, grey bars higher than 5 and white bars higher than 2. The wells corresponding to each gene are in brackets.
Figure 5
Figure 5
KEGG pathways representation with the differentially expressed genes in CD4+CD28null T lymphocytes with respect to CD4+CD28+ T lymphocytes stand out with colour. (A) Leucocyte transendothelial migration pathway (hsa 04670 entry). (B) Regulation of actin cytoskeleton pathway (hsa 04810 entry). Log2 of the fold change extracted from migration array assays was calculated, and differentially expressed genes were represented in base of this value with a colour scale from dark red (upregulated genes in CD4+CD28null T lymphocytes) to dark blue (downregulated genes in CD4+CD28null T lymphocytes). Arrows mean activation. Dashed arrows mean indirect effect. Lines mean binding. Blunt end lines mean inhibition.
Figure 6
Figure 6
Cell motility array results comparing CD4+CD28null IL-15 stimulated (test sample) with CD4+CD28null basal condition (control sample) testing the expression of 84 different genes. (A) Heatmap performed by calculating the log2 of the fold change for each gene. The figure represents the level of expression of each gene with a colour scale from dark red (more expression in CD4+CD28null+IL-15) to dark blue (less expression in CD4+CD28null+IL-15). (B) Representation of the genes with significant expression differences. Grey bars represent fold regulation of genes with an expression difference higher than five but lower than 10. White bars represent fold regulation of genes with an expression difference higher than two. The wells corresponding to each gene are in brackets.
Figure 7
Figure 7
GLISAS analysis. CD4+CD28null and CD4+CD28+ T cells were separated and, after 1 h of starvation, were incubated with and without IL-15 (50 ng/mL) stimulation. Protein extracts were obtained from each condition, and GLISAS experiments were made with them. Upper histograms show the results obtained for the RhoA protein; the left one represents the total protein RhoA concentration; the right one shows the GTPase activity of RhoA. Bottom histograms represent the GTPase activity of Rac1 (left) and Cdc42 (right). Basal conditions are represented in black; IL-15 stimulation conditions are in grey, and calpeptin positive control of RhoA activity in white.

Similar articles

Cited by

References

    1. Ogawa S., Abe R. Advances in Experimental Medicine and Biology. Volume 1189. Springer; Berlin/Heidelberg, Germany: 2019. Signal transduction via co-stimulatory and co-inhibitory receptors; pp. 85–133. - PubMed
    1. Marelli-Berg F.M., Okkenhaug K., Mirenda V. A two-signal model for T cell trafficking. Trends Immunol. 2007;28:267–273. doi: 10.1016/j.it.2007.04.008. - DOI - PubMed
    1. Dumitriu I.E. The life (and death) of CD4+ CD28(null) T cells in inflammatory diseases. Immunology. 2015;146:185–193. doi: 10.1111/imm.12506. - DOI - PMC - PubMed
    1. Moro-Garcia M.A., Alonso-Arias R., Lopez-Larrea C. When Aging Reaches CD4+ T-Cells: Phenotypic and Functional Changes. Front. Immunol. 2013;4:107. doi: 10.3389/fimmu.2013.00107. - DOI - PMC - PubMed
    1. Thewissen M., Somers V., Hellings N., Fraussen J., Damoiseaux J., Stinissen P. CD4+CD28null T cells in autoimmune disease: Pathogenic features and decreased susceptibility to immunoregulation. J. Immunol. 2007;179:6514–6523. doi: 10.4049/jimmunol.179.10.6514. - DOI - PubMed