. 2021 Jun 24;22(13):6784.
doi: 10.3390/ijms22136784.

Sp1-Induced FNBP1 Drives Rigorous 3D Cell Motility in EMT-Type Gastric Cancer Cells

Affiliations

Sp1-Induced FNBP1 Drives Rigorous 3D Cell Motility in EMT-Type Gastric Cancer Cells

Bo Kyung Yoon et al. Int J Mol Sci. .

Abstract

Cancer is heterogeneous among patients, requiring a thorough understanding of molecular subtypes and the establishment of therapeutic strategies based on its behavior. Gastric cancer (GC) is adenocarcinoma with marked heterogeneity leading to different prognoses. As an effort, we previously identified a stem-like subtype, which is prone to metastasis, with the worst prognosis. Here, we propose FNBP1 as a key to high-level cell motility, present only in aggressive GC cells. FNBP1 is also up-regulated in both the GS subtype from the TCGA project and the EMT subtype from the ACRG study, which include high portions of diffuse histologic type. Ablation of FNBP1 in the EMT-type GC cell line brought changes in the cell periphery in transcriptomic analysis. Indeed, loss of FNBP1 resulted in the loss of invasive ability, especially in a three-dimensional culture system. Live imaging indicated active movement of actin in FNBP1-overexpressed cells cultured in an extracellular matrix dome. To find the transcription factor which drives FNBP1 expression in an EMT-type GC cell line, the FNBP1 promoter region and DNA binding motifs were analyzed. Interestingly, the Sp1 motif was abundant in the promoter, and pharmacological inhibition and knockdown of Sp1 down-regulated FNBP1 promoter activity and the transcription level, respectively. Taken together, our results propose Sp1-driven FNBP1 as a key molecule explaining aggressiveness in EMT-type GC cells.

Keywords: EMT; FNBP1; Sp1; cell motility; gastric cancer.


Conflict of interest statement

The authors declare no conflict of interest.

Figures

Figure 1
Figure 1
Aggressive subtype of GC cells selectively express FNBP1. (A) Kaplan–Meier plot for FNBP1-high group (n = 94) and FNBP1-low group (n = 94) in the TCGA cohort for stomach adenocarcinoma patients. Logrank p = 0.0955. (B) Pie chart displaying the distribution of histologic subtypes of FNBP1-high group (n = 94) and FNBP1-low group (n = 94) in the TCGA STAD. Diffuse-type is marked as red. (C) Bar graph displaying the distribution of genetic subtypes of FNBP1-high and low patients (left). GS-type is marked as yellow. Mutation count is also compared (right). (D) Transcriptome data of tumors of gastric cancer patients (n = 497) in Yonsei cohort was analyzed. The expression level of FNBP1 is compared according to the subtype: mixed (n = 99), gastric (n = 89), stem-like (n = 117), intestinal (n = 102), and inflammatory (n = 90). (E) Transcriptome data of tumors of gastric cancer patients (n = 300) in the ACRG cohort (GSE66229) was analyzed. The expression levels of FNBP1 transcripts are compared according to the subtype: EMT (n = 46), MSI (n = 68), MSS/TP53+ (n = 107), and MSS/TP53- (n = 79). (F) FNBP1 expression level from CCLE (Cancer Cell Line Encyclopedia) was marked according to its origin. (G) RNAseq data of GC cell lines were analyzed. FNBP1 level is marked according to the subtype. (H) Immunoblot of FNBP1 in GC cell lines. Data represent mean ± SD. * p < 0.05; *** p < 0.001; two-tailed t-test for (G); p-value was adjusted with Benjamini–Hochberg false discovery rate method for (D,E).
Figure 2
Figure 2
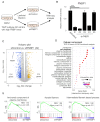
Transcriptome analysis reveals change in cell periphery. (A) Diagram to explain the experimental procedure. (B) qRT-PCR results to compare mRNA level of FNBP1 after lentiviral infection and puromycin selection. (C) Transcriptomic profile of MKN1 was analyzed via mRNA sequencing analysis after lentiviral infection. Genes with fold change greater than 2 and raw p-values smaller than 0.05 are marked in yellow. Genes with fold change less than 2 and raw p-values smaller than 0.05 are marked in blue. (D) Gene ontology enrichment analysis with differentially expressed genes. Top 20 terms of GO functional analysis in terms of cellular component are shown. The size of dots indicates intersection size, and the color denotes adjusted p-value. (E) GSEA for GO:0046658 anchored component of membrane (left), GO_CC_KERATIN_FILAMENT (middle), and GO_BP_INTERMEDIATE_FILAMENT_BASED_PROCESS (right). Data represent mean ± SD. *** p < 0.001; two-tailed t-test.
Figure 3
Figure 3
Ablation of FNBP1 results in the loss of invasion capacity. (A) Proliferation assay was done in MKN1 stable cell lines. “n.s.” indicates not significant (p > 0.05). (B) Migration capacity was compared by analyzing the area re-filled with cells after 24 h. Dotted lines denote the site of the scratch wound. Scale bar: 30 µm. (C) Confocal image shows fibrous actin distribution after fixed cells are stained with phalloidin. Images are 3D reconstructed. Scale bar: 40 µm. (D) Invasion assay was performed with stable cell lines. Cells were counted after 8 h of incubation. Scale bar: 50 µm. Data represent mean ± SD. ** p < 0.01; two-tailed t-test.
Figure 4
Figure 4
FNBP1 overexpression up-regulates cell motility via increasing membrane protrusions. (A) Diagram explaining two-dimensional and three-dimensional culture systems. Cellular movement in dense extracellular matrix, Matrigel matrix, is drawn below with arrows indicating the direction of the movement. (B) mRNA expression level in different culture conditions. “n.s.” indicates not significant (p > 0.05). (C) Confocal image showing localization of mCherry in living cells growing in Matrigel matrix. Cells were transfected with pmCherry or pmCherry-FNBP1 72 h before live-cell imaging with confocal microscopy. Arrows mark the areas enriched with FNBP1. Scale bar: 50 µm. (D) Live cell imaging of actin dynamics in FNBP1-overexpressed cells with confocal microscopy. Arrows mark the actin-enriched areas. Scale bar: 20 µm. Data represent mean ± SD.
Figure 5
Figure 5
Sp1 induces FNBP1. (A) Diagram showing Sp1 motif in FNBP1 promoter. (B) Oligonucleotide sequence of Sp1 binding motif. (C) Luciferase assay with promoter sequence introduced in (A) in HEK293T cells. 5 μM of mithramycin or vehicle of equal volume was treated for 24 h. Values were normalized by total protein amount. (D) qRT-PCR result is shown in MKN1 with Sp1 siRNA or scramble siRNA. (E) Immunoblot showing the protein level of FNBP1 upon Sp1 knockdown. Data represent mean ± SD. *** p < 0.001; two-tailed t-test.

References

    1. Dagogo-Jack I., Shaw A.T. Tumour heterogeneity and resistance to cancer therapies. Nat. Rev. Clin. Oncol. 2018;15:81–94. doi: 10.1038/nrclinonc.2017.166. - DOI - PubMed
    1. Lei Z., Tan I.B., Das K., Deng N., Zouridis H., Pattison S., Chua C., Feng Z., Guan Y.K., Ooi C.H., et al. Identification of molecular subtypes of gastric cancer with different responses to pi3-kinase inhibitors and 5-fluorouracil. Gastroenterology. 2013;145:554–565. doi: 10.1053/j.gastro.2013.05.010. - DOI - PubMed
    1. Wang Q., Liu G., Hu C. Molecular classification of gastric adenocarcinoma. Gastroenterol. Res. 2019;12:275–282. doi: 10.14740/gr1187. - DOI - PMC - PubMed
    1. Cancer Genome Atlas Research Network Comprehensive molecular characterization of gastric adenocarcinoma. Nature. 2014;513:202–209. doi: 10.1038/nature13480. - DOI - PMC - PubMed
    1. Cristescu R., Lee J., Nebozhyn M., Kim K.M., Ting J.C., Wong S.S., Liu J., Yue Y.G., Wang J., Yu K., et al. Molecular analysis of gastric cancer identifies subtypes associated with distinct clinical outcomes. Nat. Med. 2015;21:449–456. doi: 10.1038/nm.3850. - DOI - PubMed

MeSH terms

Substances