. 2021 Jun 24;10(7):1283.
doi: 10.3390/plants10071283.

Metabolite and Elastase Activity Changes in Beach Rose (Rosa rugosa) Fruit and Seeds at Various Stages of Ripeness

Affiliations

Metabolite and Elastase Activity Changes in Beach Rose (Rosa rugosa) Fruit and Seeds at Various Stages of Ripeness

Seung-Hun Chae et al. Plants (Basel). .

Abstract

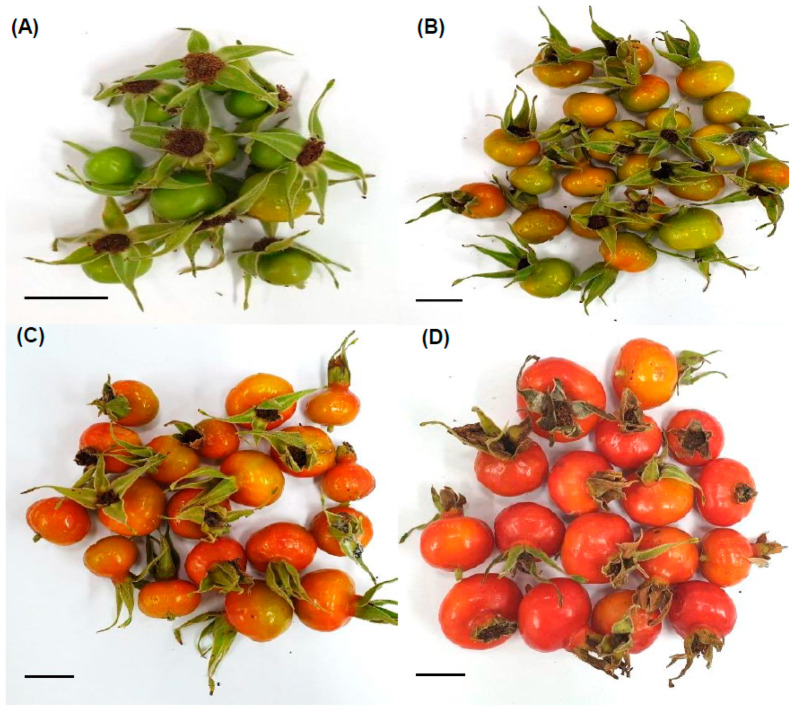
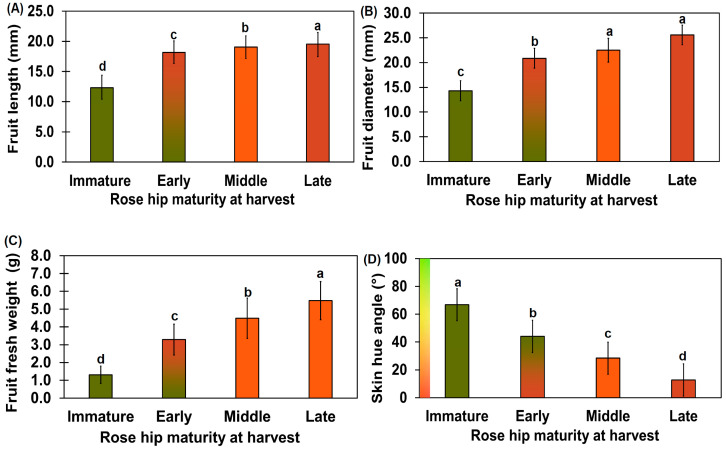
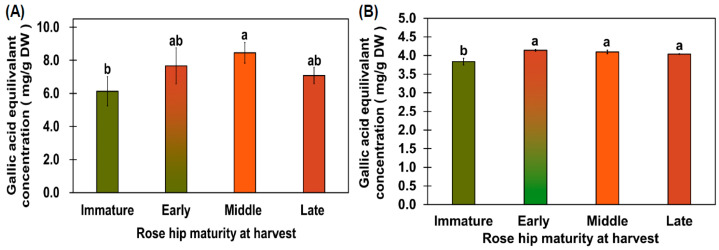
Rose hips are the fruits of the beach rose (Rosa rugosa). To determine the optimal harvest time and to obtain the maximum functional compounds, rose hips at various stages of ripeness (immature, early, mid, and late) were harvested, and the flesh tissue and seeds were separated. The rose hip flesh showed the highest total phenolic content at the mid-ripeness stage (8.45 ± 0.62 mg/g gallic acid equivalent concentration (dry weight)). The early-, mid-, and late-ripeness stages of rose hip flesh did not show significantly different 2,2-diphenyl-1-picrylhydrazyl antioxidant capacities. The elastase inhibitory activity of the 95% ethanol extract from the rose hip seeds was highest at the mid-ripeness stage; however, the elastase inhibitory activity of the rose hip tissue was not significantly different from that of the seeds. Pathway analysis using MetaboAnalyst showed that sucrose, fructose, and glucose gradually increased as the fruit ripened. Ursolic acid was detected in the seeds but not in the flesh. Of the fatty acids, linoleic acid concentrations were highest in rose hip seeds, followed by linolenic acid, oleic acid, and palmitic acid. Fatty acids and ursolic acid might be the active compounds responsible for elastase inhibitory activity and can be utilized as a functional cosmetic material.

Keywords: Rosa rugosa; antioxidant; elastase inhibitory activity; fatty acid; primary metabolite; ripening stages; rose hip.


Conflict of interest statement

The authors declare no conflict of interest.

Figures

Figure 1
Figure 1
Representative images of rose hips at various ripeness stages. (AD) indicate representative images of harvested rose hips from immature and early-, mid-, and late-ripeness stages, respectively. Each scale bar in the lower left of the picture indicates 1 cm.
Figure 2
Figure 2
Diameter (A), length (B), weight (C), and surface hue angle (D) of rose hips at various ripening stages. The diameter of the rose hip flesh was measured using digimatic calipers at the widest cross-section point (A). The length of the rose hip flesh was measured using digimatic calipers at the widest part of the longitudinal section (B). The weight of the rose hip flesh was measured using an electronic scale (C). The hue angle was determined by converting the RGB values using the OI Color Picker program (https://shaeod.tistory.com/565, accessed on 11 February 2021) and SAL 1650 camera photos (D). Different letters above the error bars indicate significant differences according to Tukey’s HSD test (p < 0.05). Number of immature rose hip samples = 14; number of early-, mid-, and late-stage rose hip samples = 16.
Figure 3
Figure 3
TPC (A) and DPPH capacity (B). TPC (A) and DPPH antioxidant capacity (B) were measured as gallic acid equivalents. The TPC of the 70% rose hip ethanol extract was measured at 715 nm using Folin–Ciocâlteu phenol reagent, whereas antioxidant activity was measured using 70% rose hip ethanol extract at 515 nm. Different letters above the error bars indicate significant differences according to Tukey’s HSD test (p < 0.05).
Figure 4
Figure 4
Elastase inhibitory activity of rose hip seeds from various ripening stages using 95% ethanol extract. Concentrations of freeze-dried rose hip seed samples were 400 µg/mL. The concentration of ursolic acid used for positive control was 50 µg/mL. Different letters above the error bars indicate significant differences according to Tukey’s HSD test (p < 0.05).
Figure 5
Figure 5
Chromatograms of water-soluble compounds (A) and amino acids from rose hip flesh (B) by GC-MS analysis. Partial least squares-discriminant analysis (PLS-DA) score plot (C) and loading plot (D) derived from GC-MS data of various ripening stages.
Figure 5
Figure 5
Chromatograms of water-soluble compounds (A) and amino acids from rose hip flesh (B) by GC-MS analysis. Partial least squares-discriminant analysis (PLS-DA) score plot (C) and loading plot (D) derived from GC-MS data of various ripening stages.
Figure 6
Figure 6
Global metabolomic profile of rose hip flesh at different maturity stages at harvest using gas chromatograph-mass spectrometry (A) and KEGG metabolism pathway analysis (B) of various ripening stages of rose hip flesh tissue. Significantly changed metabolites in the global metabolomic profile expressed in red (p < 0.01) or green letters (p < 0.05) above the heat map box according to Tukey’s HSD at p < 0.01 and 0.05, respectively. Significantly changed metabolic pathways were selected based on log10(p) value > 1.5 and impact value > 0.3 among different maturities at harvest.
Figure 7
Figure 7
Chromatograms of lipid-soluble compound (A) from rose hip seeds by GC-MS analysis. Partial least squares-discriminant analysis (PLS-DA) score plot (B), loading plot (C), and variable importance in projection (VIP) scores (D).
Figure 8
Figure 8
Red dots in the one-way ANOVA (A) indicate significantly different lipid-soluble metabolites among different rose hip maturities (p < 0.01). The specific concentrations of the lipid-soluble metabolites from rose hip seed (BH) are expressed as a bar graph. TEC indicates tetracosane equivalent concentration based on an internal standard (tetracosane). The bars and error bars represent the mean ± standard deviation of three biological replications. Letters above bars represent significant differences among different rose hip maturities Tukey’s HSD test (p < 0.05).

References

    1. Dubey S.P., Lahtinen M., Sillanpää M. Green Synthesis and Characterizations of Silver and Gold Nanoparticles Using Leaf Extract of Rosa Rugosa. Colloids Surf. A Physicochem. Eng. Asp. 2010;364:34–41. doi: 10.1016/j.colsurfa.2010.04.023. - DOI
    1. Christenhusz M.J.M., Byng J.W. The Number of Known Plants Species in the World and Its Annual Increase. Phytotaxa. 2016;261:201–217. doi: 10.11646/phytotaxa.261.3.1. - DOI
    1. Park B.-J. Isolation of Main Component and Antioxidant Activities on the Stem and Root of Rosa Rugosa. Korean J. Plant Resour. 2008;21:402–407.
    1. Gu D., Yang Y., Bakri M., Chen Q., Xin X., Aisa H.A. A Lc/Qtof-Ms/Ms Application to Investigate Chemical Compositions in a Fraction with Protein Tyrosine Phosphatase 1b Inhibitory Activity from Rosa Rugosa Flowers. Phytochem. Anal. 2013;24:661–670. doi: 10.1002/pca.2451. - DOI - PubMed
    1. Chrubasik C., Duke R.K., Chrubasik S. The evidence for clinical efficacy of rose hip and seed: A systematic review. Phytother. Res. 2006;20:1–3. doi: 10.1002/ptr.1729. - DOI - PubMed

LinkOut - more resources