. 2021 Jun 24;13(7):2182.
doi: 10.3390/nu13072182.

AB-Kefir Reduced Body Weight and Ameliorated Inflammation in Adipose Tissue of Obese Mice Fed a High-Fat Diet, but Not a High-Sucrose Diet

Affiliations

AB-Kefir Reduced Body Weight and Ameliorated Inflammation in Adipose Tissue of Obese Mice Fed a High-Fat Diet, but Not a High-Sucrose Diet

Yung-Tsung Chen et al. Nutrients. .

Abstract

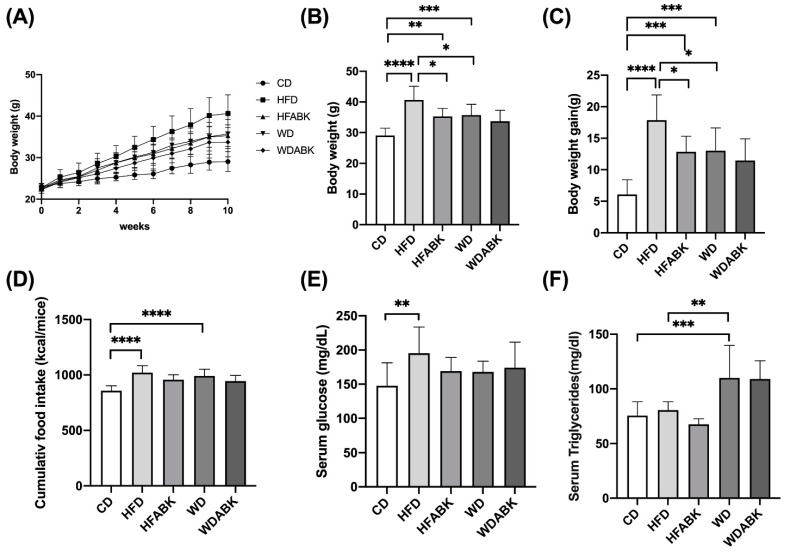
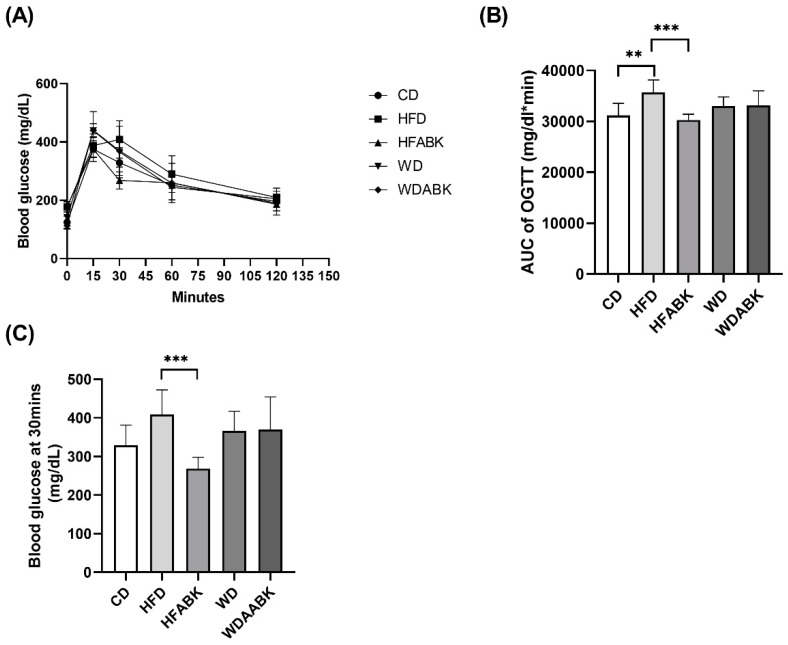
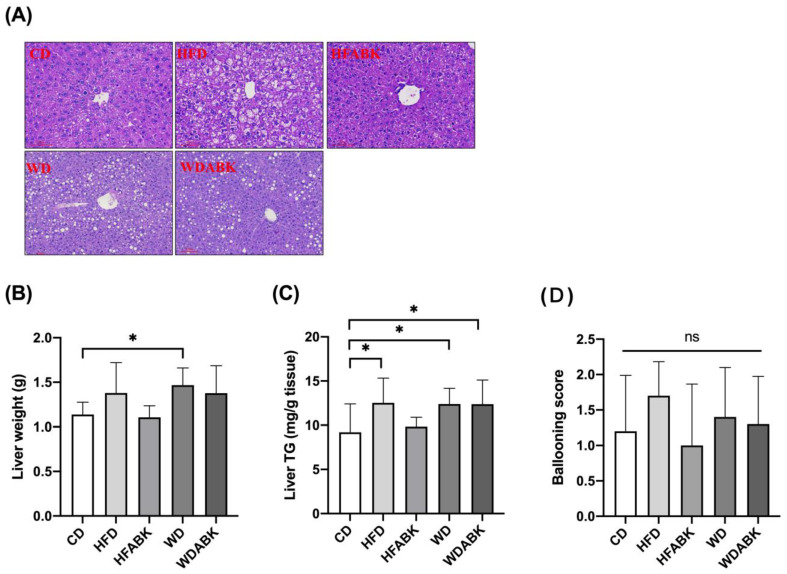
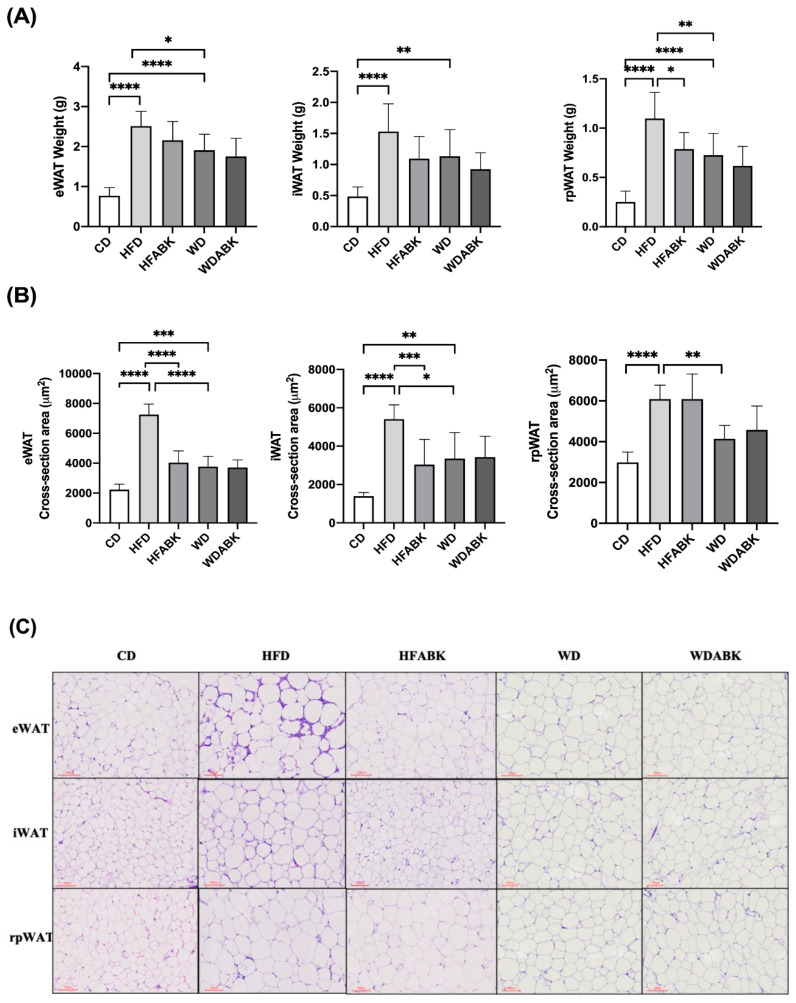
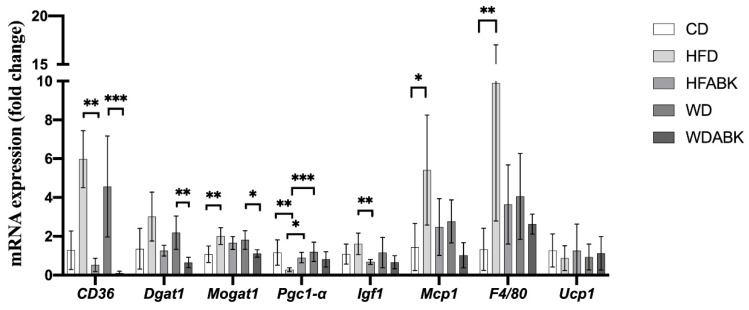
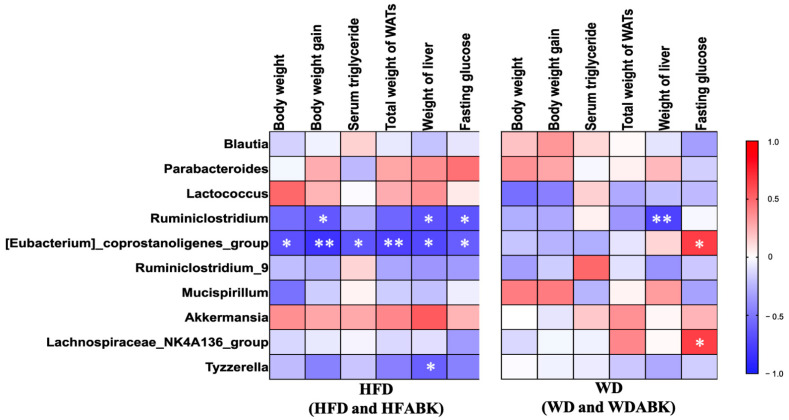
Consumption of different types of high-calorie foods leads to the development of various metabolic disorders. However, the effects of multi-strain probiotics on different types of diet-induced obesity and intestinal dysbiosis remain unclear. In this study, mice were fed a control diet, high-fat diet (HFD; 60% kcal fat and 20% kcal carbohydrate), or western diet (WD; 40% kcal fat and 43% kcal carbohydrate) and administered with multi-strain AB-Kefir containing six strains of lactic acid bacteria and a Bifidobacterium strain, at 109 CFU per mouse for 10 weeks. Results demonstrated that AB-Kefir reduced body weight gain, glucose intolerance, and hepatic steatosis with a minor influence on gut microbiota composition in HFD-fed mice, but not in WD-fed mice. In addition, AB-Kefir significantly reduced the weight and size of adipose tissues by regulating the expression of CD36, Igf1, and Pgc1 in HFD-fed mice. Although AB-Kefir did not reduce the volume of white adipose tissue, it markedly regulated CD36, Dgat1 and Mogat1 mRNA expression. Moreover, the abundance of Eubacterium_coprostanoligenes_group and Ruminiclostridium significantly correlated with changes in body weight, liver weight, and fasting glucose in test mice. Overall, this study provides important evidence to understand the interactions between probiotics, gut microbiota, and diet in obesity treatment.

Keywords: gut microbiota; inflammation; obesity; probiotics.


Conflict of interest statement

Y.-T.C., A.-H.H., S.-Y.C. and J.-S.L are employees of SYNBIO TECH INC., the manufacturer of AB-Kefir.

Figures

Figure 1
Figure 1
Effect of AB-Kefir on obesity in HFD- and WD-fed mice. Effect of AB-Kefir on (A) body weight for 10 weeks, (B) body weight at week 10, (C) body weight gain, (D) cumulative food intake, and serum levels of fasting (E) glucose and (F) triglycerides. Data are expressed as mean ± S.D. (n = 10 per group) * p < 0.05, ** p < 0.01, *** p < 0.001, **** p < 0.0001. Statistics were analyzed by using one-way ANOVA with Tukey’s post hoc test.
Figure 2
Figure 2
Effect of AB-Kefir on glucose tolerance test in HFD- and WD-fed mice. Overnight-fasted mice were administered 2.0 g/kg BW glucose by gavage. Blood samples were taken at 0, 15-, 30-, 60-, and 120-min post-administration to measure the levels of blood glucose. (A) Curve of OGTT, (B) AUC of OGTT, and (C) glucose level at 30 min of OGTT are shown. Data are expressed as mean ± SD (n = 8 per group). ** p < 0.01, *** p < 0.001. Statistics were analyzed by using one-way ANOVA with Tukey’s post hoc test.
Figure 3
Figure 3
Effect of AB-Kefir on hepatic steatosis in HFD- and WD-fed mice. (A) H&E staining of representative histological sections of the liver tissue. Scale bar = 100 µm. (B) Liver weights and (C) hepatic triglyceride levels and (D) hepatocellular ballooning score are shown. Data are expressed as mean ± SD (n = 10 per group). * p < 0.05. ns: not significant. Statistics were analyzed by using one-way ANOVA with Tukey’s post hoc test.
Figure 4
Figure 4
Effect of AB-Kefir on adipogenesis of white adipose tissue (WAT) in HFD- and WD-fed mice. (A) Weight and (B) cross-sections of epididymal, inguinal, and retroperitoneal WAT are shown. (C) H&E staining of representative histological sections of the WAT tissues. Scale bar = 100 µm. Data are expressed as mean ± S.D. (n = 8 per group) * p < 0.05, ** p < 0.01, *** p < 0.001, **** p <0.0001. Statistics were analyzed by using one-way ANOVA with Tukey’s post hoc test.
Figure 5
Figure 5
mRNA expression of adipogenesis- and inflammation-related genes in eWAT from HFD- and WD-fed mice. Data are expressed as mean ± SD. * p < 0.05, ** p < 0.01, *** p < 0.001. (n = 8 per group) Statistics were analyzed by using Kruskal–Wallis test with a post hoc Dunn’s multiple comparison test.
Figure 6
Figure 6
Effect of AB-Kefir on fecal SCFA level in HFD- and WD-fed mice. Level of (A) acetic, (B) propionic, and (C) butyric acid in feces are shown. Data are expressed as mean ± S.D. (n = 8 per group) **** p < 0.0001. Statistics were analyzed by using one-way ANOVA with Tukey’s post hoc test.
Figure 7
Figure 7
Effect of AB-Kefir on the gut microbiota composition in HFD- and WD-fed mice. (A) ACE, (B) Chao1 richness estimator, and (C) PCA plot of gut microbiota at the family level and the first two principal components, PC1 and PC2, are plotted. The five largest PCA loadings of taxa are indicated by arrows next to their genus names. (D,E) LEfSe comparison of the gut microbiota between CD, HFD, HFABK, WD, and WDABK groups. Each point represents one sample (n = 6 per group).
Figure 8
Figure 8
Spearman’s rank correlations between the top ten abundant bacterial genera and obesity-related parameters within HFD-fed mice (HFD and HFABK, n = 12) and WD-fed mice (WD and WDABK, n = 12). Spearman’s correlation analysis with an R value > 0.4 indicates a positive correlation (red color) and a value <−0.4 indicates negative correlation (blue color). * p < 0.05, ** p < 0.01.

References

    1. Santos A., San Mauro M., Sanchez A., Torres J.M., Marquina D. The antimicrobial properties of different strains of Lactobacillus spp. isolated from kefir. Syst. Appl. Microbiol. 2003;26:434–437. doi: 10.1078/072320203322497464. - DOI - PubMed
    1. Diniz R.O., Garla L.K., Schneedorf J.M., Carvalho J.C.T. Study of anti-inflammatory activity of Tibetan mushroom, a symbiotic culture of bacteria and fungi encapsulated into a polysaccharide matrix. Pharmacol. Res. 2003;47:49–52. doi: 10.1016/S1043-6618(02)00240-2. - DOI - PubMed
    1. Liu J.-R., Wang S.-Y., Lin Y.-Y., Lin C.-W. Antitumor activity of milk kefir and soy milk kefir in tumor-bearing mice. Nutr. Cancer. 2002;44:183–187. doi: 10.1207/S15327914NC4402_10. - DOI - PubMed
    1. Hertzler S.R., Clancy S.M. Kefir improves lactose digestion and tolerance in adults with lactose maldigestion. J. Am. Diet. Assoc. 2003;103:582–587. doi: 10.1053/jada.2003.50111. - DOI - PubMed
    1. Tamai Y., Yoshimitsu N., Watanabe Y., Kuwabara Y., Nagai S. Effects of milk fermented by culturing with various lactic acid bacteria and a yeast on serum cholesterol level in rats. J. Ferment. Bioeng. 1996;81:181–182. doi: 10.1016/0922-338X(96)87601-X. - DOI

MeSH terms

Substances