. 2021 Jun 20;22(12):6603.
doi: 10.3390/ijms22126603.

Alleviation of Memory Deficit by Bergenin via the Regulation of Reelin and Nrf-2/NF-κB Pathway in Transgenic Mouse Model

Affiliations

Alleviation of Memory Deficit by Bergenin via the Regulation of Reelin and Nrf-2/NF-κB Pathway in Transgenic Mouse Model

Bushra Shal et al. Int J Mol Sci. .

Abstract

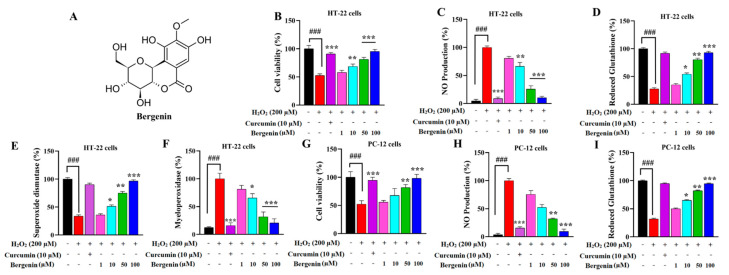
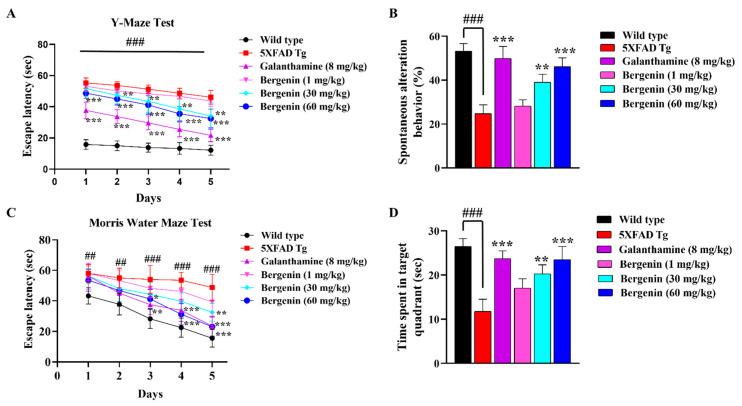
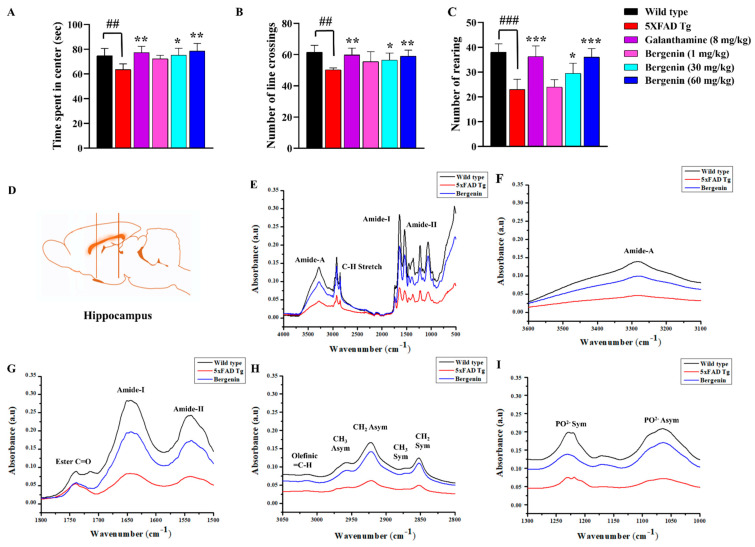
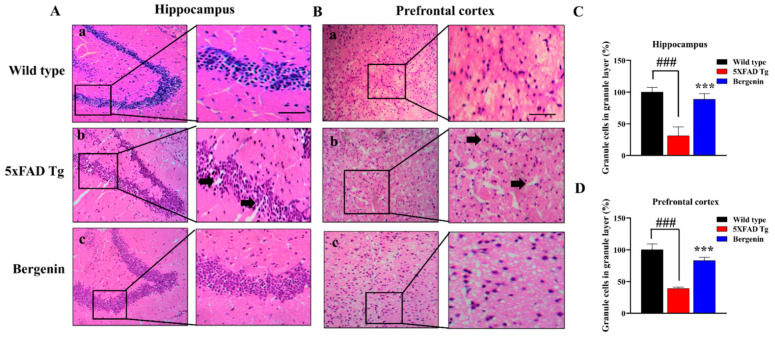
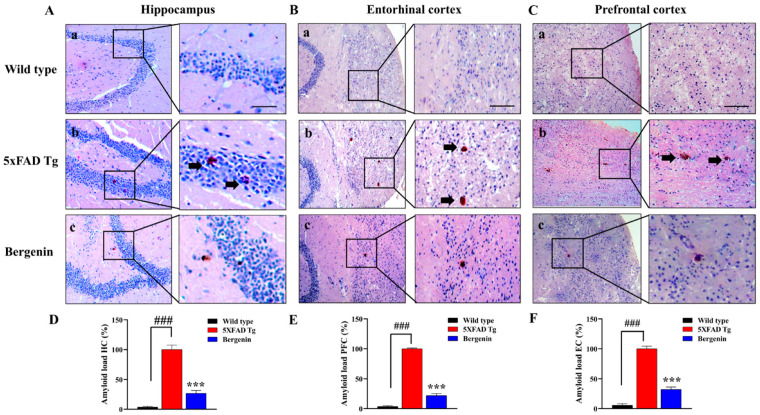
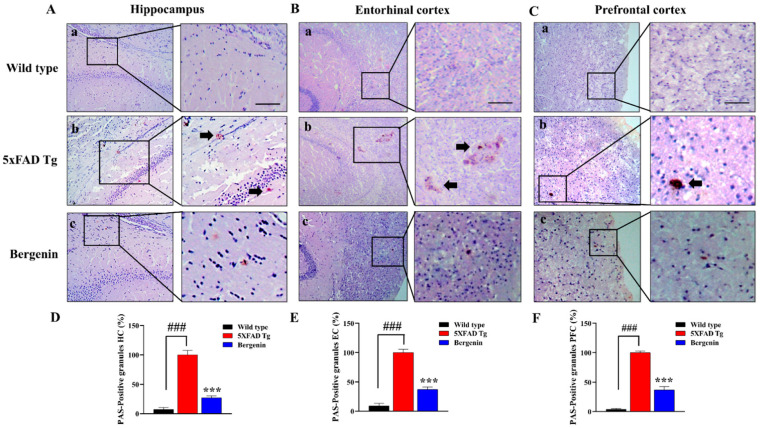
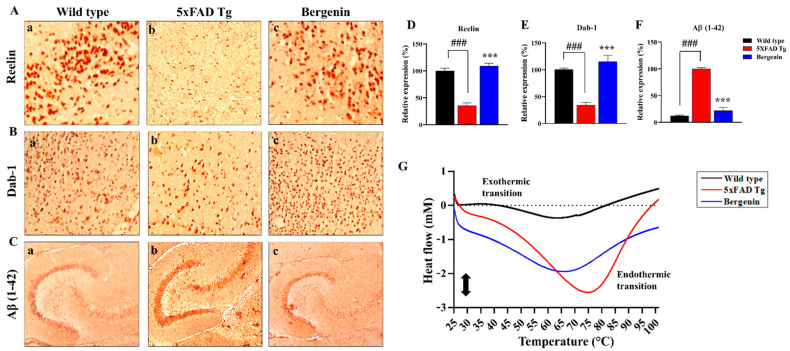
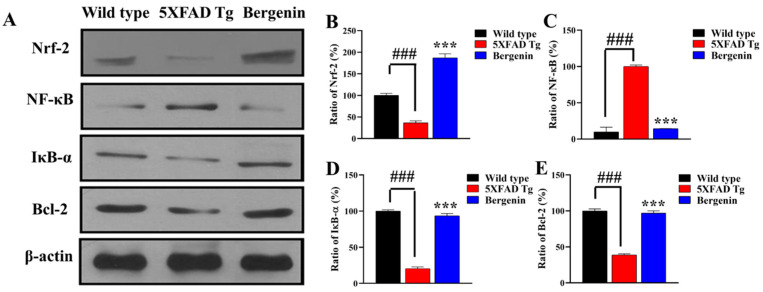
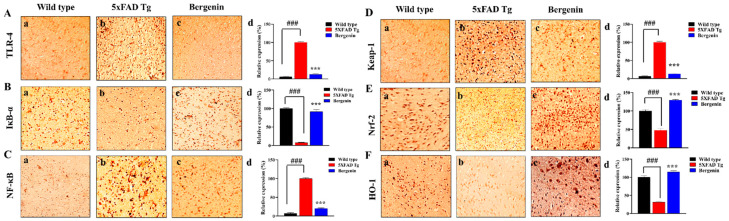
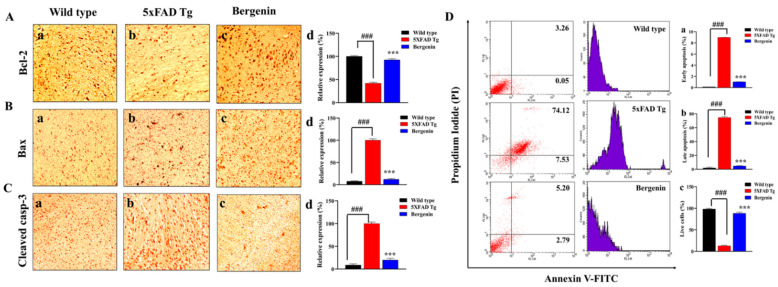
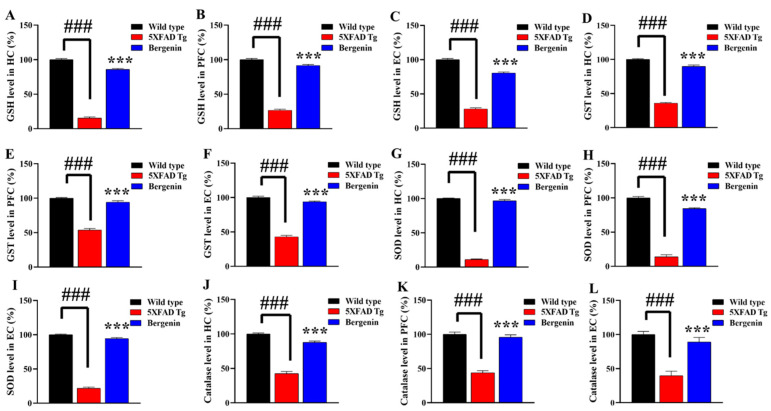
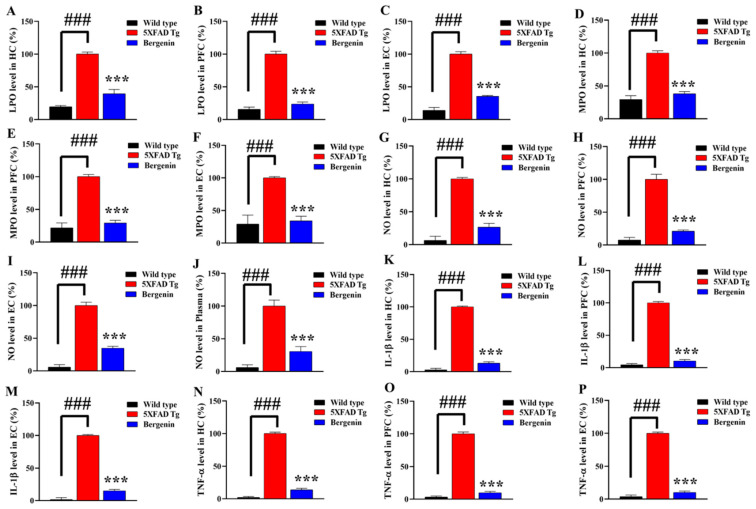
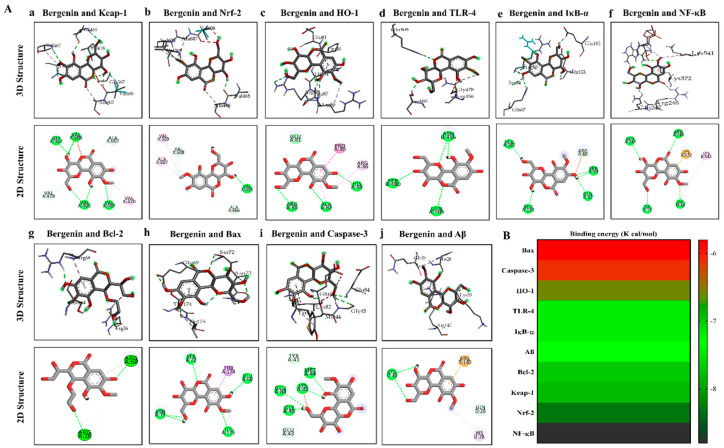
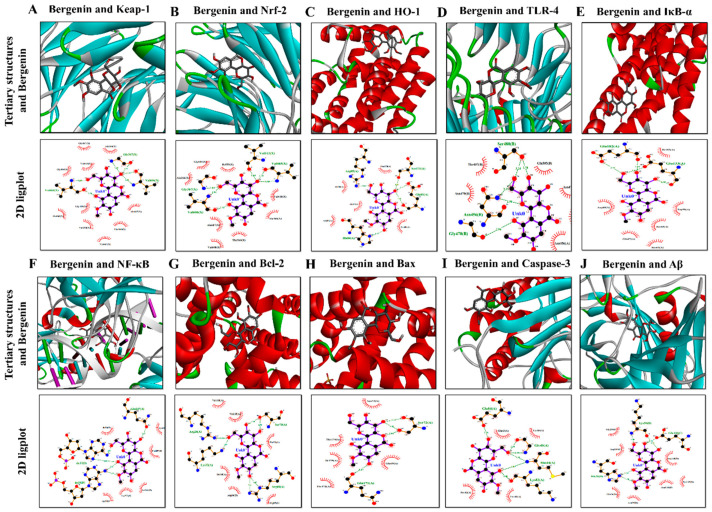
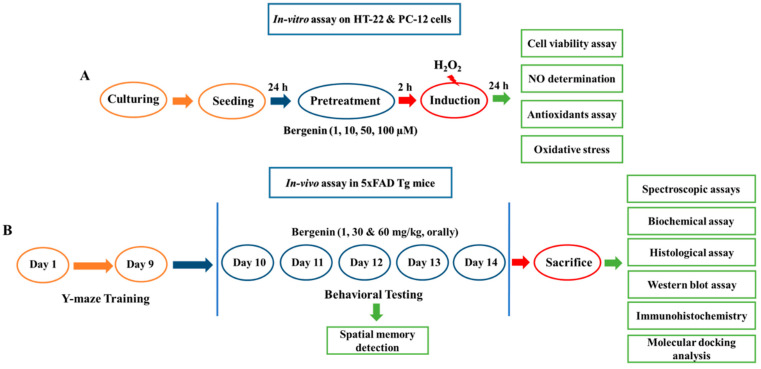
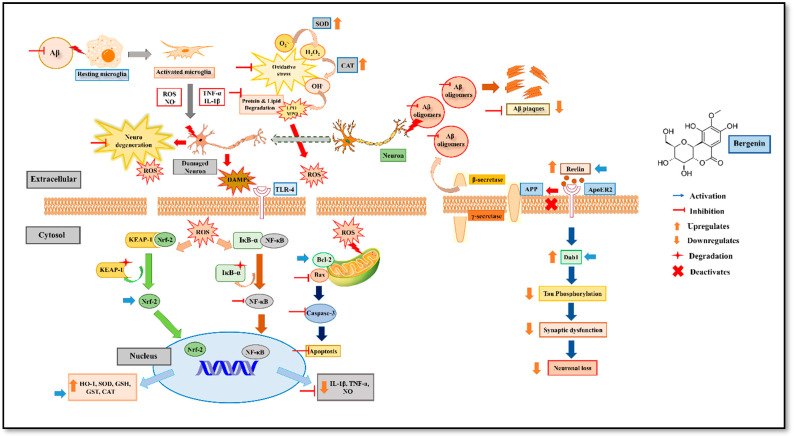
The present study aims to determine the neuroprotective effect of Bergenin against spatial memory deficit associated with neurodegeneration. Preliminarily, the protective effect of Bergenin was observed against H2O2-induced oxidative stress in HT-22 and PC-12 cells. Further studies were performed in 5xFAD Tg mouse model by administering Bergenin (1, 30 and 60 mg/kg; orally), whereas Bergenin (60 mg/kg) significantly attenuated the memory deficit observed in the Y-maze and Morris water maze (MWM) test. Fourier transform-infrared (FT-IR) spectroscopy displayed restoration of lipids, proteins and their derivatives compared to the 5xFAD Tg mice group. The differential scanning calorimeter (DSC) suggested an absence of amyloid beta (Aβ) aggregation in Bergenin-treated mice. The immunohistochemistry (IHC) analysis suggested the neuroprotective effect of Bergenin by increasing Reelin signaling (Reelin/Dab-1) and attenuated Aβ (1-42) aggregation in hippocampal regions of mouse brains. Furthermore, IHC and western blot results suggested antioxidant (Keap-1/Nrf-2/HO-1), anti-inflammatory (TLR-4/NF-kB) and anti-apoptotic (Bcl-2/Bax/Caspase-3) effect of Bergenin. Moreover, a decrease in Annexin V/PI-stained hippocampal cells suggested its effect against neurodegeneration. The histopathological changes were reversed significantly by Bergenin. In addition, a remarkable increase in antioxidant level with suppression of pro-inflammatory cytokines, oxidative stress and nitric oxide production were observed in specific regions of the mouse brains.

Keywords: Alzheimer’s disease; Bergenin; Reelin signaling; memory loss; neurodegeneration; oxidative stress.


Conflict of interest statement

The authors declare no conflict of interest.

Figures

Figure 1
Figure 1
(A) Chemical structure of Bergenin. Effect of Bergenin on (B) (%) cell viability, (C) (%) nitrite production, (D) (%) reduced glutathione, (E) (%) superoxide dismutase and (F) (%) Myeloperoxidase level in HT-22 cells exposed to H2O2 (200 µM) for 24 h. Effect of Bergenin on (G) (%) cell viability, (H) (%) nitrite production, (I) (%) reduced glutathione in PC-12 cells exposed to H2O2 (200 µM) for 24 h. Results were expressed as mean ± S.D. * p < 0.05, ** p < 0.01 and *** p < 0.001 versus the cells exposed to H2O2 alone, ### p < 0.001 versus the control (no H2O2).
Figure 2
Figure 2
Bergenin attenuated spatial memory deficit in 5xFAD Tg mice. In the Y-maze test (A) Escape latency from day 1 to 5 and (B) % Spontaneous alteration behavior (SAB) on day 14th was evaluated in all the experimental groups. In the Morris water maze (MWM) test (C) Escape latency from day 1 to 5 and (D) Time spent in the target quadrant (probe test) on day 14th was evaluated in all the experimental groups. Results were expressed as mean ± S.D (n = 10). * p < 0.05, ** p < 0.01 and *** p < 0.001 versus the transgenic mice group, ## p < 0.01 and ### p < 0.001 versus the control (wild-type).
Figure 3
Figure 3
Bergenin attenuated anxiety-like behavior in 5xFAD Tg mice and exhibited no change in locomotor activity. (A) Time spent in center (s), (B) Number of line crossings, and (C) Number of rearing were evaluated in the open field test (OFT) for all the experimental groups. Results were expressed as mean ± S.D (n = 10). * p < 0.05, ** p < 0.01 and *** p < 0.001 versus the 5xFAD Tg mice group, ## p < 0.01 and ### p < 0.001 versus the control (wild-type). (D) Diagrammatic representation of the hippocampal (HC) region in the mouse brain. FT-IR spectra of the HC region of mice brain in wild-type, 5xFAD Tg mice, and Bergenin groups in (E) 4000–500 cm−1 (Full spectra), (F) 3600–3100 cm−1 (Amide-A region), (G) 1800–1500 cm−1 (Ester C=O, Amide-I, and Amide-II region), (H) 3050–2800 cm−1 (olefinic =C-H, symmetric and asymmetric CH3, and CH2 regions), and (I) 1300–1000 cm−1 (symmetric and asymmetric PO2- region).
Figure 4
Figure 4
Representative photomicrographs of hematoxylin and eosin (H&E) stained hippocampal and prefrontal cortex region in (a) wild-type, (b) 5xFAD Tg, and (c) Bergenin groups. (A) Bergenin (60 mg/kg) displayed a regular density of granule cells with well-stained nuclei (arrows) in the hippocampal region while: (B) it prevented neuronal damage and poorly stained nuclei (arrows) in the prefrontal cortex. Scale bar = 50 µm. Quantitative analysis was done in (C) hippocampal and (D) prefrontal cortex region, results were expressed as mean ± S.D. *** p < 0.001 versus the 5xFAD Tg group, ### p < 0.001 versus the wild-type group.
Figure 5
Figure 5
Bergenin (60 mg/kg) demonstrated a decrease in amyloid load (arrows) in all the regions of interest. Representative photomicrographs of dentate gyrus region of the hippocampus, entorhinal cortex, and prefrontal cortex in (a) wild-type, (b) 5xFAD Tg, and (c) Bergenin-treated groups stained with Congo red. Scale bar = 50 µm. (DF) Quantitative analysis was performed, results were expressed as mean ± S.D (n = 3). *** p < 0.001 versus the 5xFAD Tg group, ### p < 0.001 versus the wild-type group.
Figure 6
Figure 6
Bergenin (60 mg/kg) demonstrated a decrease in PAS-positive granules (arrows) in all the regions of interest. Representative photomicrographs of (A) hippocampal CA2, (B) prefrontal cortex, and (C) entorhinal cortex region in (a) wild-type, (b) 5xFAD Tg, and (c) Bergenin groups were stained with Periodic acid-Schiff (PAS) in 5xFAD Tg mice. Scale bar = 50 µm. (DF) Quantitative analysis results were expressed as mean ± S.D. *** p < 0.001 versus the 5xFAD Tg group, ### p < 0.001 versus the wild-type group.
Figure 7
Figure 7
Bergenin demonstrated the protective effect through the Reelin-signaling pathway by inhibiting β-aggregation. Immunohistochemical analysis of (A) Reelin, (B) Dab-1 and (C) Aβ (1–42) in the hippocampal region of (a) wild-type, (b) 5xFAD Tg, and (c) Bergenin-treated groups. (DF) Represents quantitative analysis of (%) relative expression of proteins. Scale bar = 50 µm. Results were expressed as mean ± S.D. *** p < 0.001 versus the 5xFAD Tg group, ### p < 0.001 versus the wild-type group. (G) DSC heating scans (25–100 °C) displaying thermal transitions in hippocampal regions of the mouse brains in wild-type, 5xFAD Tg, and Bergenin groups.
Figure 8
Figure 8
(A) Western blot analysis in the hippocampal regions of mouse brains for Nrf-2, NF-κB, IκB-α, and Bcl-2 proteins in wild-type, 5xFAD Tg and Bergenin-treated groups. (BE) Represents quantitative analysis of target proteins expressing the ratio of percentage (%) production. Scale bar = 50 µm. Results were expressed as mean ± S.D. *** p < 0.001 versus the 5xFAD Tg group, ### p < 0.001 versus the wild-type group.
Figure 9
Figure 9
Immunohistochemical (IHC) analysis of (A) TLR-4, (B) IκB-α and (C) NF-κB proteins in the hippocampal region of (a) wild-type, (b) 5xFAD Tg, and (c) Bergenin-treated groups, (d) quantitative analysis of (%) relative expression of proteins. Immunohistochemical analysis of (D) Keap-1, (E) Nrf-2, and (F) HO-1 in hippocampal regions of mouse brains in (a) wild-type, (b) 5xFAD Tg, and (c) Bergenin-treated groups. (d) Represents the quantitative analysis of (%) relative expression of proteins. Scale bar = 50 µm. Results were expressed as mean ± S.D. *** p < 0.001 versus the 5xFAD Tg mice group, ### p < 0.001 versus the wild type.
Figure 10
Figure 10
Immunohistochemical analysis of (A) Bcl-2, (B) Bax and (C) Cleaved caspase-3 proteins in hippocampal regions of the brain in (a) wild-type, (b) 5xFAD Tg, and (c) Bergenin-treated groups, where (d) represents a quantitative analysis of (%) relative expression of proteins. (B) Flow cytometry representing Annexin V/FITC and propidium iodide staining in hippocampal neuronal cells in (a) wild-type, (b) 5xFAD Tg, and (c) Bergenin-treated groups. Quantitative analysis were represented by (a) (%) early apoptosis, (b) (%) late apoptosis, and (c) (%) live cells. Scale bar = 50 µm. Results were expressed as mean ± S.D. *** p < 0.001 versus the 5xFAD Tg mice group, ### p < 0.001 versus the wild type.
Figure 11
Figure 11
Bergenin (60 mg/kg) enhances antioxidant levels in transgenic mice. Antioxidant proteins and enzymes were determined in the hippocampal (HC), prefrontal cortex (PFC) and entorhinal cortex (EC) regions of mouse brains. (AC) Reduced glutathione (%), (DF) Glutathione-S-transferase (%), (GI) Superoxide dismutase (%) (JL) Catalase (%), level in different regions of mouse brains. Results were expressed as mean ± S.D. *** p < 0.001 versus the 5xFAD Tg mice group, ### p < 0.001 versus the wild type.
Figure 12
Figure 12
Bergenin ameliorates oxidative stress by decreasing (AC) Lipid peroxidase (%) and (DF) Myeloperoxidase (%) level in HC, PFC and EC regions of the mouse’s brain. Similarly, % Nitrite production in (G) HC, (H) PFC, (I) EC regions and (J) plasma of the mice were observed to be decreased with Bergenin treatment. Bergenin (60 mg/kg) displayed an inhibitory effect on pro-inflammatory cytokines (KM) IL-1β, and (NP) TNF-α production in HC, PFC and EC regions of mouse brains in wild-type, 5xFAD Tg and Bergenin groups. Results were expressed as mean ± S.D. *** p < 0.001 versus the transgenic (5xFAD Tg) mice group, ### p < 0.001 versus the wild type.
Figure 13
Figure 13
Molecular docking analysis of Bergenin with the active site of protein targets. (A) Three dimensional (3D) and (B) Two dimensional (2D) structural arrangement (a) Kelch-like ECH-associated protein (Keap1), (b) Nuclear factor erythroid 2-related factor 2 (Nrf-2), (c) Heme oxygenase (HO-1), (d) Toll-like receptors (TLR-4), (e) nuclear factor of kappa B inhibitor, alpha (IκB-α), (f) Nuclear factor kappa B (NF-κB), (g) B-cell lymphoma 2 (Bcl-2), (h) Bcl-2 associated X protein (Bax), (i) Caspase-3 (Casp-3), and (j) Amyloid beta (Aβ). (B) Binding energy (K cal/mol) scores were presented by Heatmap with multiple targets, i.e., Bax, Caspase-3, IκB-α, HO-1, TLR-4, Bcl-2, Keap-1, NF-κB, Nrf-2 and Aβ.
Figure 14
Figure 14
Representation of 3D (three dimensional) tertiary structure of protein with ligand and 2D (two dimensional) Ligplot structural interaction of ligand (Bergenin) with target proteins, i.e., (A) Keap1, (B) Nrf-2, (C) HO-1, (D) TLR-4, (E) IκB-α, (F) NF-κB, (G) Bcl-2, (H) Bax, (I) Casp-3 and (J) Aβ.
Figure 15
Figure 15
Schematic diagram representing the experimental design. (A) Preliminarily in-vitro assay was performed on HT-22 and PC-12 cells. (B) The in vivo assay was performed on 5xFAD Tg mouse model.
Figure 16
Figure 16
Graphical abstract representing the neuroprotective effect of Bergenin against spatial memory in 5xFAD Tg mice. Amyloid beta (Aβ), Amyloid precursor proteins (APP), Apolipoprotein E Receptor 2 (ApoER2), B-cell lymphoma 2 (Bcl-2), Bcl-2 associated X protein (Bax), Catalase (CAT), Disabled-1 adaptor protein (Dab 1), Damage associated molecular patterns (DAMPs), Glutathione (GSH), Glutathione sulfo-transferase (GST), Heme oxygenase (HO-1), Hydrogen peroxide (H2O2), Hydroxyl radical (OH-) Interleukin-1β (IL-1β), Kelch-like ECH-associated protein (Keap-1), Lipid peroxidase (LPO), Myeloperoxidase (MPO), Nitric oxide (NO), Nuclear factor kappa B (NF-κB), Nuclear factor erythroid 2-related factor 2 (Nrf-2), Superoxide radical (O2-.), Reactive oxygen species (ROS), Superoxide dismutase (SOD), Toll-like receptor (TLR-4), and Tumor necrosis factor-α (TNF-α).

References

    1. Ano Y., Dohata A., Taniguchi Y., Hoshi A., Uchida K., Takashima A., Nakayama H. Iso-α-acids, Bitter Components of Beer, Prevent Inflammation and Cognitive Decline Induced in a Mouse Model of Alzheimer’s Disease. J. Biol. Chem. 2017;292:3720–3728. doi: 10.1074/jbc.M116.763813. - DOI - PMC - PubMed
    1. Jawhar S., Trawicka A., Jenneckens C., Bayer T.A., Wirths O. Motor deficits, neuron loss, and reduced anxiety coinciding with axonal degeneration and intraneuronal Aβ aggregation in the 5XFAD mouse model of Alzheimer’s disease. Neurobiol. Aging. 2012;33:196.e29–196.e40. doi: 10.1016/j.neurobiolaging.2010.05.027. - DOI - PubMed
    1. O’Brien R.J., Wong P.C. Amyloid precursor protein processing and Alzheimer’s disease. Annu. Rev. Neurosci. 2011;34:185–204. doi: 10.1146/annurev-neuro-061010-113613. - DOI - PMC - PubMed
    1. Albert M.S., DeKosky S.T., Dickson D., Dubois B., Feldman H.H., Fox N.C., Gamst A., Holtzman D.M., Jagust W.J., Petersen R.C., et al. The diagnosis of mild cognitive impairment due to Alzheimer’s disease: Recommendations from the National Institute on Aging-Alzheimer’s Association workgroups on diagnostic guidelines for Alzheimer’s disease. Alzheimer’s Dement. J. Alzheimer’s Assoc. 2011;7:270–279. doi: 10.1016/j.jalz.2011.03.008. - DOI - PMC - PubMed
    1. Chin J., Massaro C.M., Palop J.J., Thwin M.T., Yu G.Q., Bien-Ly N., Bender A., Mucke L. Reelin depletion in the entorhinal cortex of human amyloid precursor protein transgenic mice and humans with Alzheimer’s disease. J. Neurosci. Off. J. Soc. Neurosci. 2007;27:2727–2733. doi: 10.1523/JNEUROSCI.3758-06.2007. - DOI - PMC - PubMed

MeSH terms