

Virtual Biopsy for Diagnosis of Chemotherapy-Associated Liver Injuries and Steatohepatitis: A Combined Radiomic and Clinical Model in Patients with Colorectal Liver Metastases
- PMID: 34203103
- PMCID: PMC8234168
- DOI: 10.3390/cancers13123077
Virtual Biopsy for Diagnosis of Chemotherapy-Associated Liver Injuries and Steatohepatitis: A Combined Radiomic and Clinical Model in Patients with Colorectal Liver Metastases
Abstract
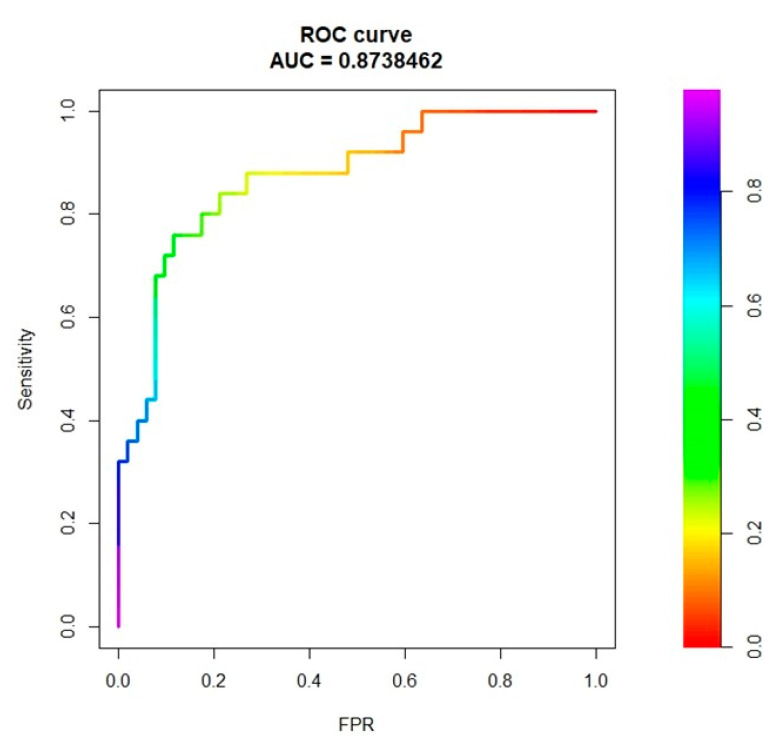
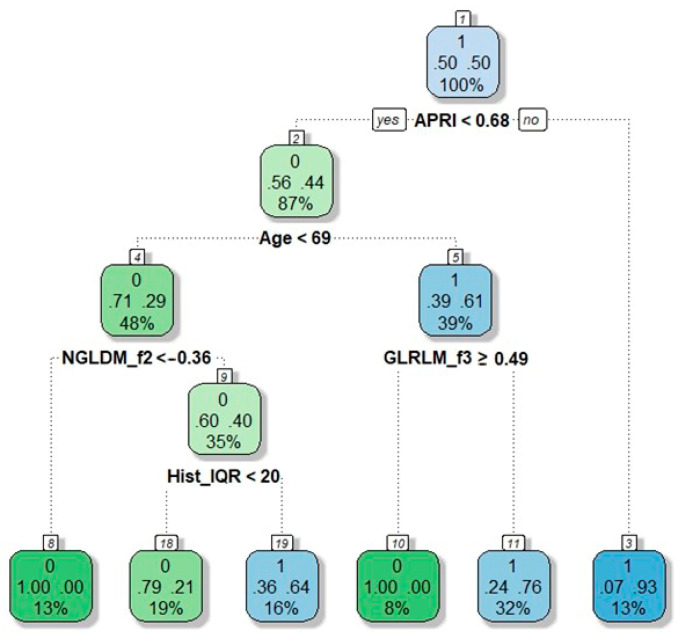
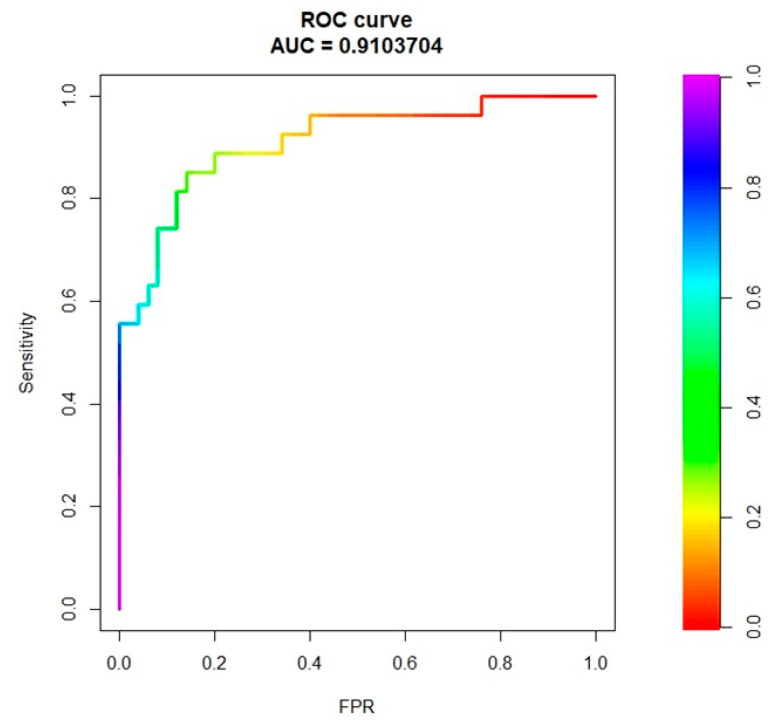
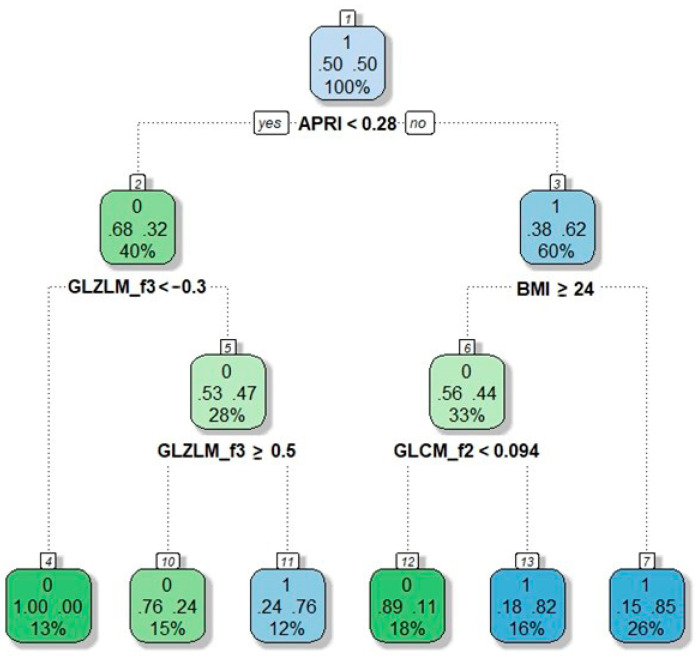
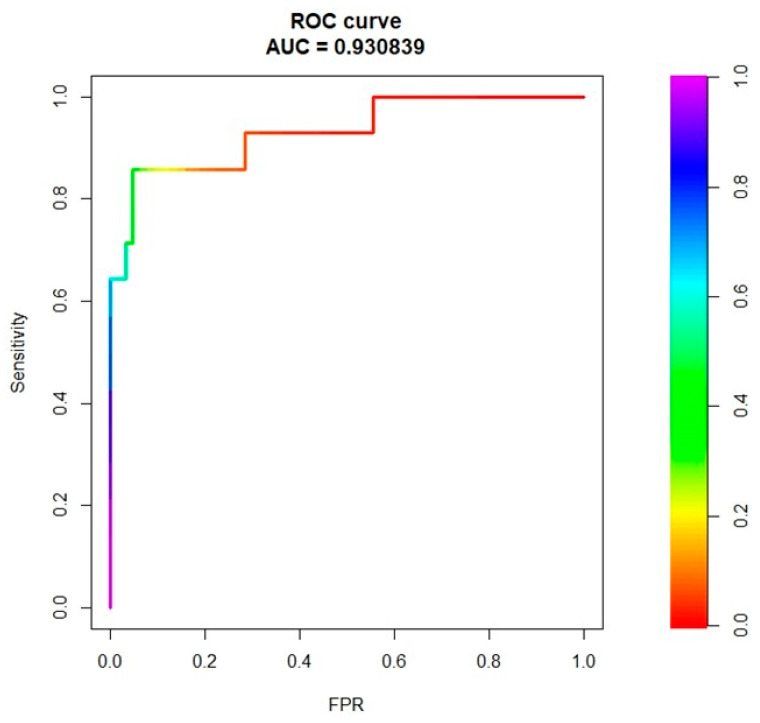
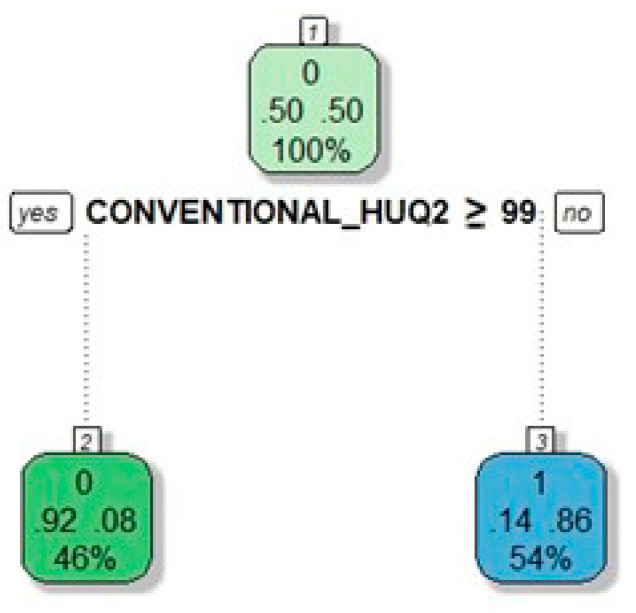
Non-invasive diagnosis of chemotherapy-associated liver injuries (CALI) is still an unmet need. The present study aims to elucidate the contribution of radiomics to the diagnosis of sinusoidal dilatation (SinDil), nodular regenerative hyperplasia (NRH), and non-alcoholic steatohepatitis (NASH). Patients undergoing hepatectomy for colorectal metastases after chemotherapy (January 2018-February 2020) were retrospectively analyzed. Radiomic features were extracted from a standardized volume of non-tumoral liver parenchyma outlined in the portal phase of preoperative post-chemotherapy computed tomography. Seventy-eight patients were analyzed: 25 had grade 2-3 SinDil, 27 NRH, and 14 NASH. Three radiomic fingerprints independently predicted SinDil: GLRLM_f3 (OR = 12.25), NGLDM_f1 (OR = 7.77), and GLZLM_f2 (OR = 0.53). Combining clinical, laboratory, and radiomic data, the predictive model had accuracy = 82%, sensitivity = 64%, and specificity = 91% (AUC = 0.87 vs. AUC = 0.77 of the model without radiomics). Three radiomic parameters predicted NRH: conventional_HUQ2 (OR = 0.76), GLZLM_f2 (OR = 0.05), and GLZLM_f3 (OR = 7.97). The combined clinical/laboratory/radiomic model had accuracy = 85%, sensitivity = 81%, and specificity = 86% (AUC = 0.91 vs. AUC = 0.85 without radiomics). NASH was predicted by conventional_HUQ2 (OR = 0.79) with accuracy = 91%, sensitivity = 86%, and specificity = 92% (AUC = 0.93 vs. AUC = 0.83 without radiomics). In the validation set, accuracy was 72%, 71%, and 91% for SinDil, NRH, and NASH. Radiomic analysis of liver parenchyma may provide a signature that, in combination with clinical and laboratory data, improves the diagnosis of CALI.
Keywords: chemotherapy-associated liver injuries; colorectal liver metastases; diagnostic imaging; liver surgery; nodular regenerative hyperplasia; radiomics; sinusoidal dilatation; steatohepatitis; textural features; virtual liver biopsy.
Conflict of interest statement
A.C.: COI: no COIs pertinent to this work; COIs outside this work: received speaker’s honoraria from the following companies: Advanced Accelerator Applications, General Electric Healthcare, Sirtex Medical Europe, AmGen Europe, travel grants form General Electric Healthcare and Sirtex Medical Europe; he is a member of Blue Earth Diagnostics’ and Advanced Accelerator Applications’ advisory boards and received scientific support, in terms of a three-year Ph.D. fellowship, from the Sanofi Genzyme. F.F.: COI: no COIs pertinent to this work; COIs outside this work acts as a consultant for the MSD Sharp & Dohme GmbH (LLC). All remaining authors have declared no conflicts of interest.
Figures
Similar articles
-
A virtual biopsy of liver parenchyma to predict the outcome of liver resection.Updates Surg. 2023 Sep;75(6):1519-1531. doi: 10.1007/s13304-023-01495-7. Epub 2023 Apr 5. Updates Surg. 2023. PMID: 37017906
-
Reversibility of chemotherapy-related liver injury.J Hepatol. 2017 Jul;67(1):84-91. doi: 10.1016/j.jhep.2017.02.031. Epub 2017 Mar 9. J Hepatol. 2017. PMID: 28284915
-
Nodular Regenerative Hyperplasia in Patients Undergoing Liver Resection for Colorectal Metastases After Chemotherapy: Risk Factors, Preoperative Assessment and Clinical Impact.Ann Surg Oncol. 2015 Dec;22(13):4149-57. doi: 10.1245/s10434-015-4533-0. Epub 2015 Apr 7. Ann Surg Oncol. 2015. PMID: 25845431
-
Nodular regenerative hyperplasia (NRH) complicating oxaliplatin chemotherapy in patients undergoing resection of colorectal liver metastases.Eur J Surg Oncol. 2014 Aug;40(8):1016-20. doi: 10.1016/j.ejso.2013.09.015. Epub 2013 Nov 1. Eur J Surg Oncol. 2014. PMID: 24370284
-
DCE-MRI Radiomics Analysis in Differentiating Luminal A and Luminal B Breast Cancer Molecular Subtypes.Acad Radiol. 2023 Jan;30(1):22-29. doi: 10.1016/j.acra.2022.04.004. Epub 2022 May 17. Acad Radiol. 2023. PMID: 35595629
Cited by
-
The Histopathological Growth Pattern of Colorectal Liver Metastases Impacts Local Recurrence Risk and the Adequate Width of the Surgical Margin.Ann Surg Oncol. 2022 Sep;29(9):5515-5524. doi: 10.1245/s10434-022-11717-8. Epub 2022 Jun 10. Ann Surg Oncol. 2022. PMID: 35687176
-
Tumor classification of gastrointestinal liver metastases using CT-based radiomics and deep learning.Cancer Imaging. 2023 Oct 5;23(1):95. doi: 10.1186/s40644-023-00612-4. Cancer Imaging. 2023. PMID: 37798797 Free PMC article.
-
Radiomics and machine learning analysis by computed tomography and magnetic resonance imaging in colorectal liver metastases prognostic assessment.Radiol Med. 2023 Nov;128(11):1310-1332. doi: 10.1007/s11547-023-01710-w. Epub 2023 Sep 11. Radiol Med. 2023. PMID: 37697033
-
Artificial intelligence and radiation effects on brain tissue in glioblastoma patient: preliminary data using a quantitative tool.Radiol Med. 2023 Jul;128(7):813-827. doi: 10.1007/s11547-023-01655-0. Epub 2023 Jun 8. Radiol Med. 2023. PMID: 37289266
-
A virtual biopsy of liver parenchyma to predict the outcome of liver resection.Updates Surg. 2023 Sep;75(6):1519-1531. doi: 10.1007/s13304-023-01495-7. Epub 2023 Apr 5. Updates Surg. 2023. PMID: 37017906
References
-
- Van Cutsem E., Cervantes A., Adam R., Sobrero A., Van Krieken J.H., Aderka D., Aranda Aguilar E., Bardelli A., Benson A., Bodoky G., et al. ESMO consensus guidelines for the management of patients with metastatic colorectal cancer. Ann. Oncol. 2016;27:1386–1422. doi: 10.1093/annonc/mdw235. - DOI - PubMed
-
- Nordlinger B., Sorbye H., Glimelius B., Poston G.J., Schlag P.M., Rougier P., Bechstein W.O., Primrose J.N., Walpole E.T., Finch-Jones M., et al. Perioperative FOLFOX4 chemotherapy and surgery versus surgery alone for resectable liver metastases from colorectal cancer (EORTC 40983): Long-term results of a randomised, controlled, phase 3 trial. Lancet Oncol. 2013;14:1208–1215. doi: 10.1016/S1470-2045(13)70447-9. - DOI - PubMed
-
- Viganó L., Capussotti L., Barroso E., Nuzzo G., Laurent C., Ijzermans J.N.M., Gigot J.F., Figueras J., Gruenberger T., Mirza D.F., et al. Progression while receiving preoperative chemotherapy should not be an absolute contraindication to liver resection for colorectal metastases. Ann. Surg. Oncol. 2012;19:2786–2796. doi: 10.1245/s10434-012-2382-7. - DOI - PubMed
Grants and funding
LinkOut - more resources
Full Text Sources
Medical
Miscellaneous
