. 2021 Jun 28;22(13):6918.
doi: 10.3390/ijms22136918.

Disruption of O-Linked N-Acetylglucosamine Signaling in Placenta Induces Insulin Sensitivity in Female Offspring

Affiliations

Disruption of O-Linked N-Acetylglucosamine Signaling in Placenta Induces Insulin Sensitivity in Female Offspring

Mackenzie Moore et al. Int J Mol Sci. .

Abstract

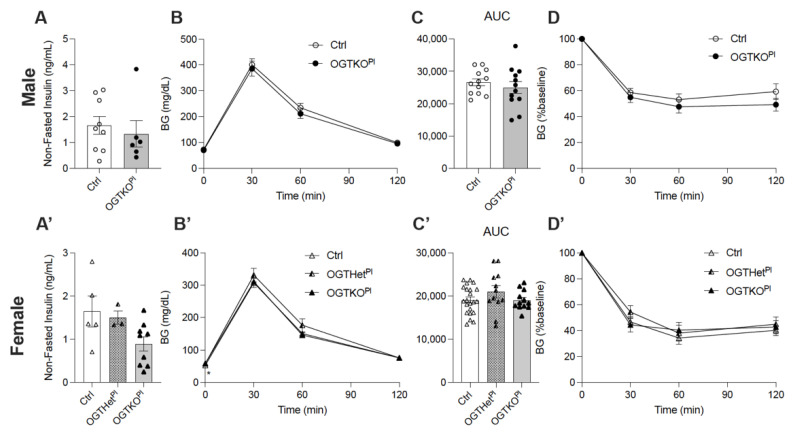
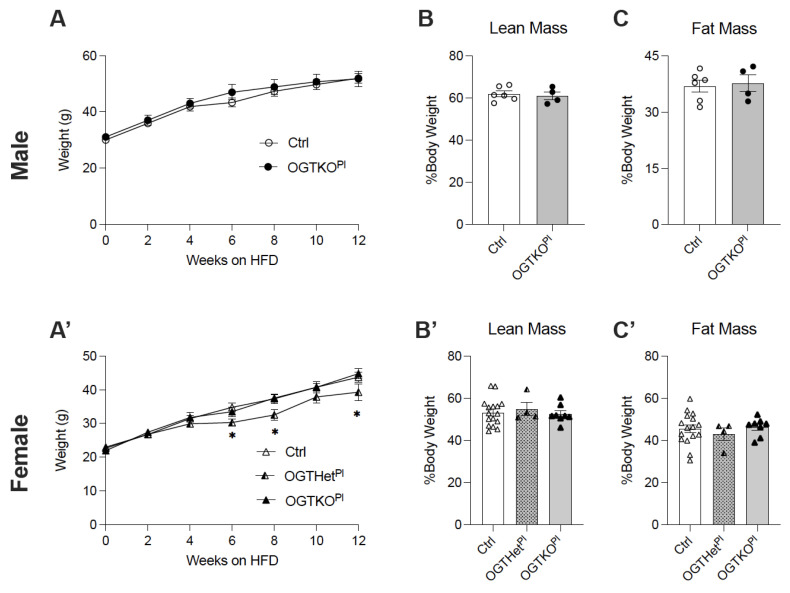
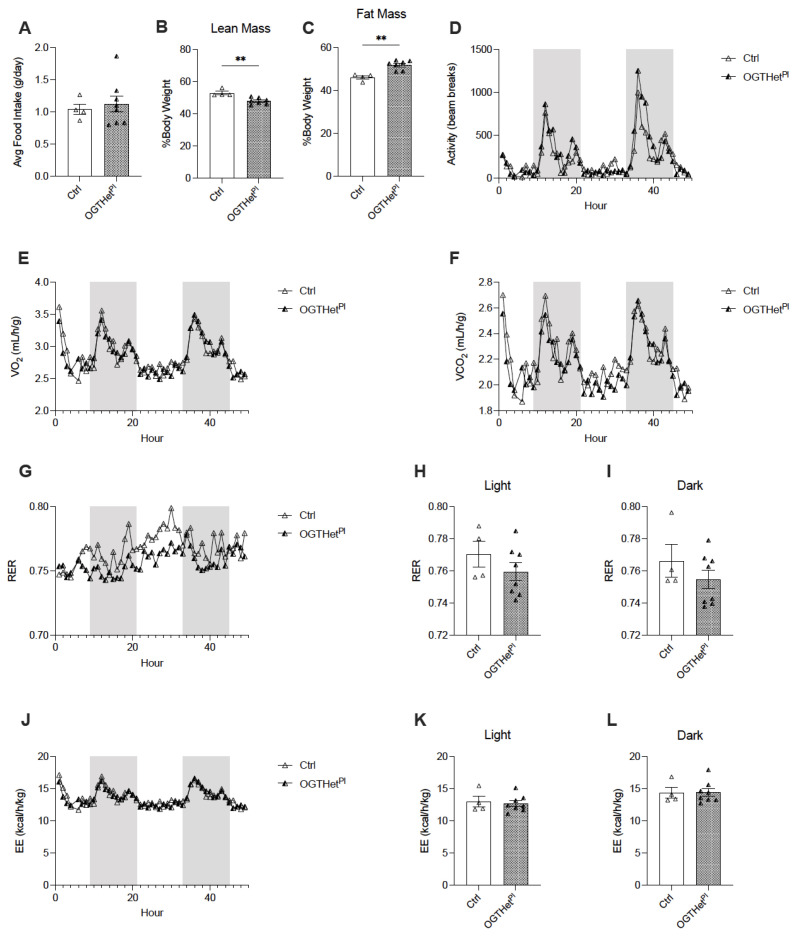
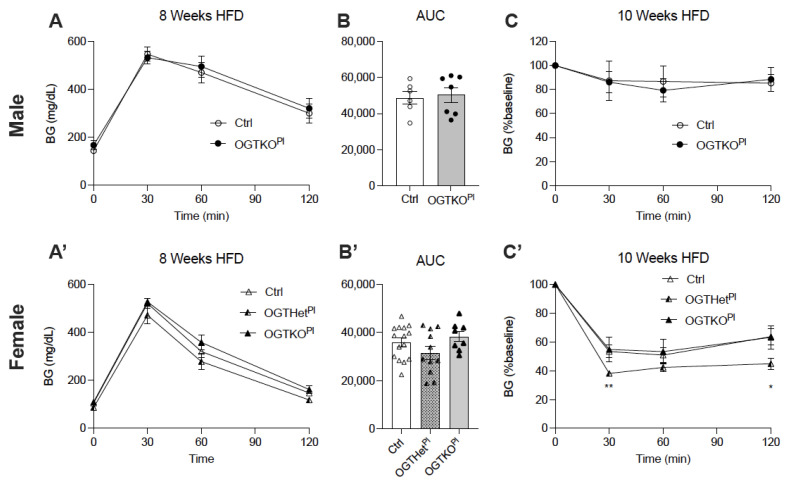
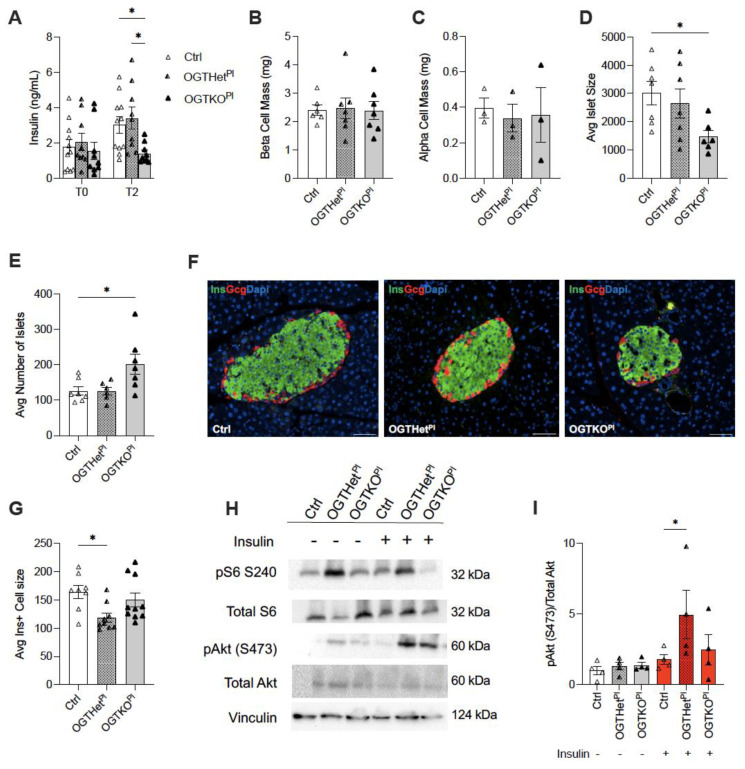
Placental dysfunction can lead to fetal growth restriction which is associated with perinatal morbidity and mortality. Fetal growth restriction increases the risk of obesity and diabetes later in life. Placental O-GlcNAc transferase (OGT) has been identified as a marker and a mediator of placental insufficiency in the setting of prenatal stress, however, its role in the fetal programming of metabolism and glucose homeostasis remains unknown. We aim to determine the long-term metabolic outcomes of offspring with a reduction in placental OGT. Mice with a partial reduction and a full knockout of placenta-specific OGT were generated utilizing the Cre-Lox system. Glucose homeostasis and metabolic parameters were assessed on a normal chow and a high-fat diet in both male and female adult offspring. A reduction in placental OGT did not demonstrate differences in the metabolic parameters or glucose homeostasis compared to the controls on a standard chow. The high-fat diet provided a metabolic challenge that revealed a decrease in body weight gain (p = 0.02) and an improved insulin tolerance (p = 0.03) for offspring with a partially reduced placental OGT but not when OGT was fully knocked out. Changes in body weight were not associated with changes in energy homeostasis. Offspring with a partial reduction in placental OGT demonstrated increased hepatic Akt phosphorylation in response to insulin treatment (p = 0.02). A partial reduction in placental OGT was protective from weight gain and insulin intolerance when faced with the metabolic challenge of a high-fat diet. This appears to be, in part, due to increased hepatic insulin signaling. The findings of this study contribute to the greater understanding of fetal metabolic programming and the effect of placental OGT on peripheral insulin sensitivity and provides a target for future investigation and clinical applications.

Keywords: O-GlcNAcylation; O-linked N-acetylglucosamine (GlcNAc) transferase; OGT; beta-cells; fetal programming; glucose homeostasis; islet; metabolism; pancreas; placenta.


Conflict of interest statement

The authors declare no conflict of interest.

Figures

Figure 1
Figure 1
Reduced placental OGT in female offspring on normal chow had an increase in fasting BG. (A) Non-fasted insulin at 12 weeks of normal chow for male mice (n = 5, 7). (A’) Non-fasted insulin of female mice at 12 weeks of NC (n = 3, 9). (B) IPGTT and (C) calculated AUC for male (n = 12) and (B’,C’) female mice (n = 12, 22) at 6 weeks on normal chow. (D) ITT at 8 weeks on normal chow for male (n = 13, 14) and (D’) females (n = 12, 18). Blood glucose values post insulin injection are expressed as a percent of baseline blood glucose. (A,C) were presented as mean ± SEM, unpaired t-test for males and one-way ANOVA for females. (B,D) were presented as mean ± SEM, two-way ANOVA. p values, * p < 0.05.
Figure 2
Figure 2
Placental OGT heterozygote females have decreased body weight starting at 6 weeks of HFD. (A) Body weight monitored across 12 weeks of HFD for males (n = 6, 7) and (A’) females (n = 10, 17). (B) Lean mass of males (n = 4, 6) and (B’) females (n = 4, 16) after 12 weeks HFD as assessed by EchoMRI. (C) Fat mass of males (n = 4, 6) and (C’) females (n = 4, 16) after 12 weeks HFD as assessed by EchoMRI. (A) was presented as mean ± SEM, two-way ANOVA. (B,C) were presented as mean ± SEM, unpaired t-test for males and one-way ANOVA for females. p values, * p < 0.05.
Figure 3
Figure 3
Increased fat mass and decreased lean mass for OGTHetPl female mice but no difference in energy balance on HFD. (A) Daily food intake of HFD averaged over three days for female mice (n = 4, 8). (B) Lean and (C) fat mass of females (n = 4, 7) after 16 weeks HFD as assessed by EchoMRI. (D) Activity evaluated by beam breaks, (E) Volume of oxygen (VO2) consumption, and (F) volume of carbon dioxide (VCO2) generation over 72 h (n = 4, 8) with 12 h light and dark cycles. Dark cycle designated by the shaded region. (G) Respiratory exchange ratio (RER) over 72 h (n = 4, 8) with 12 h light and dark cycles. Dark cycle designated by the shaded region. (H) Averaged RER for light and (I) dark cycles (n = 4, 8). (J) Energy expenditure (EE) over 72 h (n = 4, 8) with 12 h light and dark cycles. Dark cycle designated by the shaded region. (K) Averaged EE for light and (L) dark cycles (n = 4, 8). (AC,H,I,K,L) was presented as mean ± SEM, unpaired t-test. (DF,G,J) were presented as mean, two-way ANOVA. p values, ** p < 0.01.
Figure 4
Figure 4
Heterozygote placental OGT female mice demonstrated increased insulin tolerance. (A) IPGTT and (B) calculated AUC at 8 weeks of HFD for male (n = 6, 7) and (A’,B’) female mice (n = 8, 15). (C) ITT at 10 weeks on HFD for male (n = 4, 5) and (C’) females (n = 7, 15). Blood glucose values post insulin injection are expressed as a percent of baseline blood glucose. (A,C) were presented as mean ± SEM, two-way ANOVA. (B) was presented as mean ± SEM, unpaired t-test for males and one-way ANOVA for females. p values, * p < 0.05, ** p < 0.01.
Figure 5
Figure 5
Increased pS473 (pAKT) in the liver of OGTHetPl mice in response to insulin treatment after 12 weeks HFD. (A) In vivo glucose stimulated insulin secretion (GSIS) for females (n = 9, 11). T0 is a fasted state. T2 is two minutes post insulin injection. (B) beta cell mass in females after 12 weeks on HFD (n = 7). (C) ⍺ cell mass in females after 12 weeks on HFD (n = 3). (D) Average islet size for females after 12 weeks on HFD (n = 7). (E) Average number of islets for females after 12 weeks on HFD (n = 7). (F) Representative islets from each female genotype post HFD for 12 weeks with insulin (green), glucagon (red), and DAPI (blue) immunostaining. Magnification 20×, scale bars 50 µm. (G) Average islet cell size for females after 12 weeks on HFD (n = 8, 10). (H) Western blot for pAKT (pS473), total Akt, pS6 (S240), and total S6 in the liver following injection of insulin or injection of PBS as a control. Samples were taken from females on 12 weeks HFD (n = 4). (I) Quantification of western blot for pAKT (pS473)/total Akt from liver samples visualized in (G). (A) was presented as mean ± SEM, two-way ANOVA. (BE,G,I) were presented as mean ± SEM, one-way ANOVA. p values, * p < 0.05.

References

    1. Lima V.V., Dela Justina V., Dos Passos R.R., Jr., Volpato G.T., Souto P.C.S., San Martin S., Giachini F.R. O-GlcNAc Modification During Pregnancy: Focus on Placental Environment. Front. Physiol. 2018;9:1263. doi: 10.3389/fphys.2018.01263. - DOI - PMC - PubMed
    1. Barker D.J. The origins of the developmental origins theory. J. Intern. Med. 2007;261:412–417. doi: 10.1111/j.1365-2796.2007.01809.x. - DOI - PubMed
    1. Nugent B.M., Bale T.L. The omniscient placenta: Metabolic and epigenetic regulation of fetal programming. Front. Neuroendocrinol. 2015;39:28–37. doi: 10.1016/j.yfrne.2015.09.001. - DOI - PMC - PubMed
    1. Gheorghe C.P., Goyal R., Mittal A., Longo L.D. Gene expression in the placenta: Maternal stress and epigenetic responses. Int. J. Dev. Biol. 2010;54:507–523. doi: 10.1387/ijdb.082770cg. - DOI - PMC - PubMed
    1. Wadhwa P.D., Buss C., Entringer S., Swanson J.M. Developmental origins of health and disease: Brief history of the approach and current focus on epigenetic mechanisms. Semin. Reprod. Med. 2009;27:358–368. doi: 10.1055/s-0029-1237424. - DOI - PMC - PubMed