. 2021 Jun 28;22(13):6953.
doi: 10.3390/ijms22136953.

CaFtsH06, A Novel Filamentous Thermosensitive Protease Gene, Is Involved in Heat, Salt, and Drought Stress Tolerance of Pepper (Capsicum annuum L.)

Affiliations

CaFtsH06, A Novel Filamentous Thermosensitive Protease Gene, Is Involved in Heat, Salt, and Drought Stress Tolerance of Pepper (Capsicum annuum L.)

Jing-Jing Xiao et al. Int J Mol Sci. .

Abstract

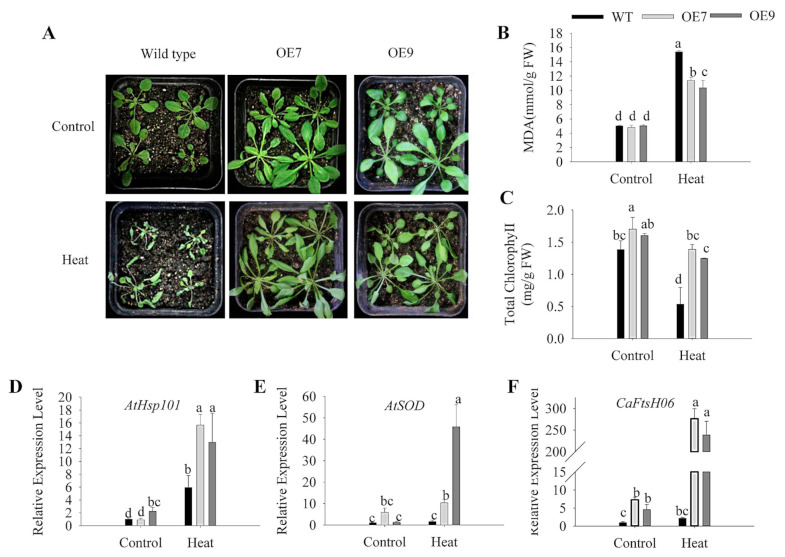
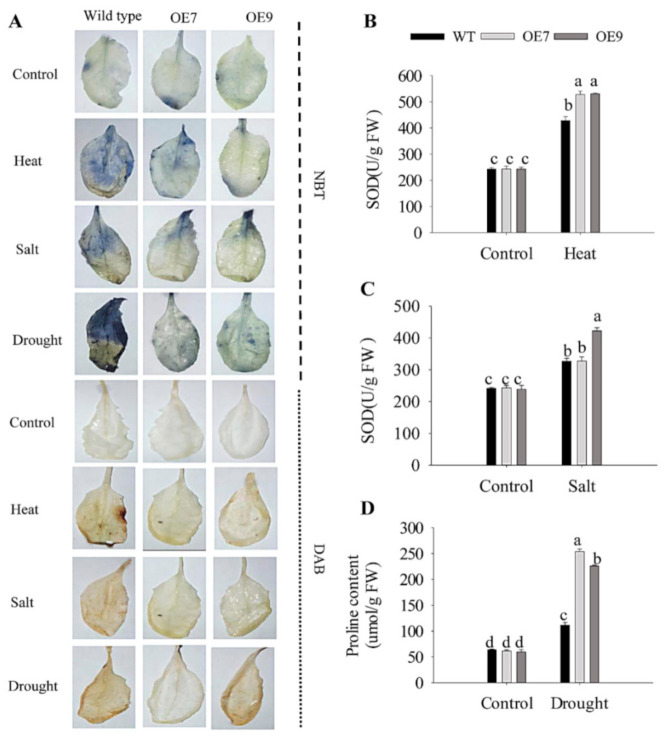
Harsh environmental factors have continuous negative effects on plant growth and development, leading to metabolic disruption and reduced plant productivity and quality. However, filamentation temperature-sensitive H protease (FtsH) plays a prominent role in helping plants to cope with these negative impacts. In the current study, we examined the transcriptional regulation of the CaFtsH06 gene in the R9 thermo-tolerant pepper (Capsicum annuum L.) line. The results of qRT-PCR revealed that CaFtsH06 expression was rapidly induced by abiotic stress treatments, including heat, salt, and drought. The CaFtsH06 protein was localized to the mitochondria and cell membrane. Additionally, silencing CaFtsH06 increased the accumulation of malonaldehyde content, conductivity, hydrogen peroxide (H2O2) content, and the activity levels of superoxide dismutase and superoxide (·O2-), while total chlorophyll content decreased under these abiotic stresses. Furthermore, CaFtsH06 ectopic expression enhanced tolerance to heat, salt, and drought stresses, thus decreasing malondialdehyde, proline, H2O2, and ·O2- contents while superoxide dismutase activity and total chlorophyll content were increased in transgenic Arabidopsis. Similarly, the expression levels of other defense-related genes were much higher in the transgenic ectopic expression lines than WT plants. These results suggest that CaFtsH06 confers abiotic stress tolerance in peppers by interfering with the physiological indices through reducing the accumulation of reactive oxygen species, inducing the activities of stress-related enzymes and regulating the transcription of defense-related genes, among other mechanisms. The results of this study suggest that CaFtsH06 plays a very crucial role in the defense mechanisms of pepper plants to unfavorable environmental conditions and its regulatory network with other CaFtsH genes should be examined across variable environments.

Keywords: CaFtsH06; Capsicum annuum L.; ROS-scavenging system; abiotic stress; transgenic Arabidopsis.


Conflict of interest statement

The authors declare there are no conflict of interest.

Figures

Figure 1
Figure 1
Heat map of CaFtsHs family gene expression in pepper. (A) Dynamic heat map of the CaFtsHs family genes in different tissues and organs of pepper. L1 and L9 stand for leaves collected at 2 d and 60 d after emergence, respectively; F1 and F9 describe the smallest and largest flower buds, respectively; FST0 indicates the fruit collected at 3 days after flowering (DAF); T5 and T11 stand for placenta collected at 30 and 60 (DAF), respectively; S5 and S11 show seeds collected at 30 and 60 DAF, respectively; G5 and G11 represent peels collected at 30 and 60 DAF, respectively. (B) Expression pattern of CaFtsHs family genes in pepper under heat stress. CL0/CR0 stand for control in leaves/roots, respectively, and HL/HR stand for expression levels of CaFtsHs genes after heat stress (42 °C) in leaves/roots at 0, 0.5, 1, 3, 6, 12, and 24 h t, respectively. (C) Expression of CaFtsHs family genes in pepper under salt stress (200 mM NaCl). CL0/CR0 represent control in leaves/roots, respectively; NL/NR stand for levels of CaFtsHs genes in leaves/roots at 0, 0.5, 1, 3, 6, 12, and 24 h post-treatment, respectively. (D) Profile of CaFtsHs family genes in pepper leaf and root tissues under osmotic stress (400 mM mannitol). CL0/CR0, ML1/MR1, ML2/MR2, ML3/MR3, ML4/MR4, ML5/MR5, and ML6/MR6 show the expression levels of CaFtsHs genes in leaves/roots at 0, 0.5, 1, 3, 6, 12, and 24 h post-treatment, respectively. The date was normalized with log2 transformation. (E) The conserve motifs of CaFtsH are shown in different colors. TM (transmembrane domain), SRH (second region of homology), Zn2+ metalloprotease domain (protease), and the conserved ATPase domains of Walker A and B are marked. Two transmembrane domains (TM domain, blue) and transit peptide (black) regions are shown.
Figure 2
Figure 2
Analysis of the change in CaFtsH06 expression in pepper plants under heat stress. (A) Detection of background heat tolerance of CaFtsH06 in pepper. (B) Detection of acquired heat tolerance associated with CaFtsH06 in pepper. (C) A time course of high temperature treatment and normal temperature recovery, with the arrows indicating the time points at which pepper leaves were collected (samples I–VI). Different letters denote statistical significance (p < 0.05).
Figure 3
Figure 3
Analysis of the characteristics of FtsH protein structures. Multiple alignments of the deduced amino acid sequences of CaFtsH06, AtFtsH6, LeFtsH6, and FtsH/E. coli, with the FtsH-specific motif shown by a rectangular box. Part of the protein sequence is drawn with a colored rectangle to match the figure in (Figure 1E).
Figure 4
Figure 4
Analysis of the characteristics of CaFtsH06 protein’s subcellular localization. The localization of pVBG2307:CaFtsH6:GFP fusion protein in tobacco cells (I-II), with pVBG2307:GFP as a control. Bright light: cells in bright field; GFP: fluorescence of GFP protein under green fluorescence; merged: overlapped image of GFP and bright light. Bar = 50 μm.
Figure 5
Figure 5
The phenotypes and silencing efficiency of CaFtsH06 in pepper leaves. (A) The phenotypes of TRV2:CaPDS positive control plants, TRV2:00 negative control plants, and pTRV2:CaFtsH06-silenced plants are shown, respectively. (B) Silencing efficiency of CaFtsH06 in pepper. Different letters denote statistical significance (p < 0.05).
Figure 6
Figure 6
Analysis of heat tolerance of CaFtsH06-silenced pepper. (A) Phenotype identification of pTRV2:00 and pTRV2:CaFtsH06-silenced plants after heat treatment. (B) The malondialdehyde (MDA) content of plants after heat stress. (C) Total chlorophyll content of plants after heat stress. (D) The SOD content of plants after heat stress. Different letters denote statistical significance (p < 0.05).
Figure 7
Figure 7
Salt stress tolerance analysis in silenced pepper. (A) Phenotypes of pTRV2:00 and pTRV2:CaFtsH06-silenced plants after salt stress. (B) The MDA content of plants after salt stress. (C) Total chlorophyll content of plants after salt stress. (D) The SOD content of plants after salt stress. (E) The relative electrolyte leakage of plants after salt stress. Different letters denote statistical significance (p < 0.05). For the osmotic tolerance analysis of silent and control plants, the roots of the plant samples were cleaned first and then completely immersed in a 300 mM mannitol solution. The silent and control plants were then subjected to 36 h of drought treatment, and the leaves of CaFtsH06-silenced plants were observed to exhibited lost water tension, sagging and shrinking, while the control plants did not change significantly (Figure 8A).
Figure 8
Figure 8
Analysis of osmotic tolerance of CaFtsH06-silenced pepper. (A) Phenotype identification of pTRV2:00 and pTRV2:CaFtsH6 plants after osmotic stress. (B) The MDA content of plants after osmotic stress. (C) The proline content of plants after osmotic stress. (D) Total chlorophyll content of plants after osmotic stress. Different letters denote statistical significance (p < 0.05).
Figure 9
Figure 9
Histochemical staining of pepper leaves under heat, salt, and osmotic stresses in the CaFtsH06-silenced and control pepper plants. The NBT and DAB staining in CaFtsH06-silenced plant leaves after heat, salt, and drought stress treatments revealed darker stanning patterns than the control plants, indicating the accumulation of ·O2 and H2O2, respectively.
Figure 10
Figure 10
Heat stress tolerance analysis of WT and CaFtsH06-expressing Arabidopsis lines following 40 °C treatment for 24 h. (A) The phenotype of WT and CaFtsH06-expressing Arabidopsis lines. (B,C) MDA and total chlorophyll contents of activity of WT and transgenic Arabidopsis. (DF) Relative expression level of WT and CaFtsH06-expressing Arabidopsis lines. Different letters denote statistical significance (p < 0.05).
Figure 11
Figure 11
Phenotypic observations and physiological and transcriptional analysis after salt stress in the WT and CaFtsH06-expressing Arabidopsis plants watered with a 200 mM NaCl solution for 14 days. (A) Phenotypes of CaFtsH06-OE Arabidopsis and WT plants. (B,C) MDA and chlorophyll contents of the WT and transgenic Arabidopsis plants. (DG) Expression levels of CaFtsH06 and other stress-related genes in transgenic Arabidopsis and WT plants under salt stress. Different letters denote statistical significance (p < 0.05).
Figure 12
Figure 12
Drought stress tolerance analysis of wild-type (WT) and transgenic CaFtsH06-expressing Arabidopsis seedlings. (A) Phenotypes of WT and CaFtsH06-expressing Arabidopsis seedlings following the withholding of water for seven days. (B,C) MDA content and total chlorophyll content of CaFtsH06-expressing and WT Arabidopsis plants. The drought stress was applied by not watering the seedlings for seven days. (DH) The transcript levels of genes related to drought stress in the transgenic and WT Arabidopsis plants. Different letters denote statistical significance (p < 0.05).
Figure 13
Figure 13
Study on the scavenging characteristics of reactive oxygen species (ROS) of wild-type and transgenic plants. (A) NBT and DAB staining of WT and transgenic plants after different stress treatments. (B) SOD activity of WT and transgenic lines under heat stress. (C) SOD activity of WT and transgenic plants under salt stress. (D) Proline content of WT and transgenic lines under drought stress. NBT and DAB staining showed accumulation of ·O2 and H2O2, respectively. The error bars show the SD of three biological replicates, and values shown with different lowercase letters were significantly different at a p ≤ 0.05 level of significance. Different letters denote statistical significance (p < 0.05).

References

    1. Zhai Y., Wang H., Liang M., Lu M. Both silencing-and over-expression of pepper CaATG8c gene compromise plant tolerance to heat and salt stress. Environ. Exp. Bot. 2017;141:10–18. doi: 10.1016/j.envexpbot.2017.06.009. - DOI
    1. Zhu J.K. Abiotic stress signaling and responses in plants. Cell. 2016;167:313–324. doi: 10.1016/j.cell.2016.08.029. - DOI - PMC - PubMed
    1. Khan A., Li R.J., Sun J.T., Ma F., Zhang H.X., Jin J. Genome-wide analysis of dirigent gene family in pepper (Capsicum annuum L.) and characterization of CaDIR7 in biotic and abiotic stresses. Sci. Rep. 2018;8:1–21. - PMC - PubMed
    1. Allakhverdiev S.I., Kreslavski V.D., Klimov V.V., Los D.A., Carpentier R., Mohanty P. Heat stress: An overview of molecular responses in photosynthesis. Photosynth. Res. 2008;98:541–550. doi: 10.1007/s11120-008-9331-0. - DOI - PubMed
    1. Ahuja I., de Vos R.C., Bones A.M., Hall R.D. Plant molecular stress responses face climate change. Trends Plant Sci. 2010;15:664–674. doi: 10.1016/j.tplants.2010.08.002. - DOI - PubMed

MeSH terms

LinkOut - more resources