. 2021 Jun 28;10(7):596.
doi: 10.3390/biology10070596.

Modulation of Stem Cell Progeny by Probiotics during Regeneration of Gastric Mucosal Erosions

Affiliations

Modulation of Stem Cell Progeny by Probiotics during Regeneration of Gastric Mucosal Erosions

Farah Al-Yassir et al. Biology (Basel). .

Abstract

Patients with gastric mucosal erosions are predisposed to chronic gastritis, ulcer or even cancer. The repair of mucosal erosions involves several events including proliferation of gastric epithelial stem cells. The aim of this study was to investigate the effects of the probiotic mixture of De Simone Formulation on gastric epithelial stem cell lineages in mouse models of gastric mucosal erosions. Gastric erosions were induced by a single oral gavage of 80% ethanol containing 15 mg/mL acetylsalicylic acid (5 mL/kg) following a daily dose of probiotic mixture (5 mg/day/mouse) for 10 days. In another protocol, erosions were induced by a daily gavage of acetylsalicylic acid (400 mg/kg/day/mouse) for 5 days before or after daily administration of probiotic mixture for 5 days. Control mice received water gavage for 10 days. All mice were injected with bromodeoxyuridine two hours before sacrifice to label S-phase cells. The stomachs of all mice were processed for histological examination, lectin binding, and immunohistochemical analysis. The results reveal that mice that received probiotics before or after the induction of erosion showed a decrease in erosion index with an increase in gastric epithelial stem/progenitor cell proliferation and enhanced production of mucus, trefoil factors, and ghrelin by mucous and enteroendocrine cell lineages. These mice also showed restoration of the amount of H+,K+-ATPase and pepsinogen involved in the production of the harsh acidic environment by parietal and chief cell lineages. In conclusion, this study demonstrates the beneficial effects of probiotics against gastric mucosal erosion and highlights the involvement and modulation of proliferative stem cells and their multiple glandular epithelial cell lineages.

Keywords: H+,K+-ATPase; cell proliferation; gastric erosion; mucus; probiotics; trefoil factor.


Conflict of interest statement

The authors declare no conflict of interest.

Figures
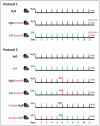
Figure 1
Figure 1
Design of the two experimental protocols carried out in this study. Protocol 1 was repeated in 3 experiments and each time, 3 littermate male mice were used (n = 9). They were labeled as H2O (control), H2O-erosion, and DSF-erosion. Protocol 2 was repeated in 5 experiments and each included 6 mice (n = 30) labeled as H2O, DSF, H2O-erosion, DSF-erosion, erosion-H2O, and erosion-DSF.
Figure 2
Figure 2
Body weight gain (A) and gastric erosion index (B) in control (H2O), erosion-induced, and DSF-pretreated then, erosion-induced mice. The body weight gain was measured after 6 and 11 days of starting the experiment. Data from 3 mice in each group are presented as mean ± SE. Differences in body weight gain among the three groups of mice were not statistically significant. Gastric erosion index is reduced in mice given DSF for 10 days and then ASA-containing ethanol on day 11. This reduction was statistically significant when compared with the erosion-induced group (** p <0.01). Data are presented as mean ± SE.
Figure 3
Figure 3
PAS-stained gastric mucosae of H2O control (A), erosion-induced (B) and DSF-pretreated then erosion-induced (C) mice. The red arrows in (B,C) are pointing to mucosal erosions. Note that the area of erosion is smaller in (C) than in (B). (D) Measurements of the gastric mucosal thickness in control, erosion-induced and DSF-pretreated erosion-induced mice. Data are presented from 3 animals per group as mean ± SE. Comparing the groups shows significance only between H2O-erosion and the H2O control. * p < 0.05; scale bar = 100 µm.
Figure 4
Figure 4
BrdU labeling in the gastric mucosae of H2O control (A), erosion-induced (B) and DSF-pretreated then erosion-induced (C) mice. The tissues were counter-stained with PAS to show mucus-secreting pit cells at the luminal surface. (D) Counts of the BrdU-labeled cells in control, erosion-induced and DSF-pretreated then erosion-induced mice (n = 3 per group) are presented as mean ± SE. In this figure and all following figures, asterisks above columns indicate significant difference when the value of that column is compared with the H2O control. Asterisks above the line indicate differences between adjacent groups ** p < 0.01, *** p < 0.001; scale bar = 100 µm.
Figure 5
Figure 5
H+,K+-ATPase immunolabeling in the gastric mucosae of H2O control (A), erosion-induced (B) and DSF-pretreated then erosion-induced (C) mice. The tissue sections were counterstained with hematoxylin and PAS. Specific antibodies against H+,K+-ATPase β-subunit were used to label parietal cells distributed throughout the gastric glands. (D) Quantification of H+,K+-ATPase labeling intensity per field is presented from three mice in each group as mean ± SE. * p < 0.05; scale bar = 200 µm.
Figure 6
Figure 6
Double lectin histochemistry of the gastric mucosa of H2O control (A), erosion-induced (B) and DSF-erosion (C) mice. Stomach tissue sections were incubated with rhodamine-conjugated UEA-I lectin (red) and GSII-FITC (Green). UEA-I demarcates the surface mucous cells lining the luminal surface and the mucosal pits. GSII lectin defines the mucous neck cells in the middle of the mucosa. (D) Fold change in the levels of UEA-I and GSII labeling intensity of control (n = 3), gastric lesion (n = 3) and DSF-erosion (n = 3) tissues (D) are presented as mean ± SE. * p < 0.05, ** p < 0.01; scale bar = 100 µm.
Figure 7
Figure 7
TFF1 immunolabeling in the gastric mucosae of H2O control (A), erosion-induced (B) and DSF-erosion (C) mice. The tissue sections were counterstained with hematoxylin. Brownish TFF1-labeled cells are seen at the luminal surface and in the pit regions. (D) Quantifications of TFF1 labeling intensity is calculated from three mice in each group and presented as mean ± SE. * p < 0.05; scale bar = 200 µm.
Figure 8
Figure 8
TFF2 immunolabeling in the gastric mucosae of H2O control (A), erosion-induced (B) and DSF-pretreated (C) mice. The tissue sections were counterstained with hematoxylin. Brownish TFF2-labeled cells are seen in the middle of the gastric mucosae. Labeled cells are more apparent in DSF-pretreated tissues than in control and erosion-induced tissues. (D) Quantification of TFF2 labeling intensity per field is presented from three mice in each group as mean ± SE. * p < 0.05 and ** p < 0.01; scale bar = 200 µm.
Figure 9
Figure 9
Pepsinogen immunolabeling in the gastric mucosae of H2O control (A), erosion-induced (B) and DSF-erosion (C) mice. The tissue sections were counterstained with hematoxylin. Brownish pepsinogen-labeled cells are seen in the basal regions of the gastric mucosae. Labeled cells are more prominent in control and DSF-pretreated tissues than in erosion-induced tissues. (D) Quantification of pepsinogen labeling intensity (or percentage of labeled pixels in equivalent areas) of the mucosa of three mice in each group is presented as mean ± SE. * p < 0.05; scale bar = 100 µm.
Figure 10
Figure 10
Ghrelin immunolabeling in the gastric mucosae of H2O control (A), erosion-induced (B) and DSF-erosion (C) mice. The tissue sections were counterstained with PAS and hematoxylin. Small brownish ghrelin-labeled cells are seen scattered mostly in the basal regions of the gastric mucosae. (D) Quantification of ghrelin-labeled cells per field of the mucosa of three mice in each group is presented as mean ± SE. ** p < 0.01; scale bar = 200 µm.
Figure 11
Figure 11
Characterization of the 6 groups of mice of the second protocol of multiple-ASA-gavage erosion model. The graphs show body weight gain (A), gastric erosion index (B), BrdU-labeling (C), H+,K+-ATPase immunolabeling intensity (D), UEA lectin labeling (E) and GS lectin labeling (F). In all graphs, data are presented for each group of 5 mice as mean ± SE. Asterisks above the columns compare the value of that column with the H2O control group and on the horizontal lines compare adjacent paired groups. * p < 0.05, ** p < 0.01, *** p < 0.001.

Similar articles

Cited by

References

    1. Tarnawski A., Ahluwalia A., Jones M.K. Gastric cytoprotection beyond prostaglandins: Cellular and molecular mechanisms of gastroprotective and ulcer healing actions of antacids. Curr. Pharm. 2013;19:126–132. doi: 10.2174/13816128130117. - DOI - PubMed
    1. Al-Awadhi H., John R., Al-Marzooqi F., Vincze A., Branicki F., Karam S.M. Sequential alterations in gastric biopsies and tumor tissues support the multistep process of carcinogenesis. Histol. Histopath. 2011;26:1153–1164. doi: 10.14670/HH-26.1153. - DOI - PubMed
    1. Zanotti G., Cendron L. Structural Aspects of Helicobacter pylori Antibiotic Resistance. Adv. Exp. Med. Biol. 2019;1149:227–241. doi: 10.1007/5584_2019_368. - DOI - PubMed
    1. Karam S.M., Forte J.G. Inhibiting gastric H(+)-K(+)-ATPase activity by omeprazole promotes degeneration and production of parietal cells. Am. J. Physiol. 1994;266:G745–G758. doi: 10.1152/ajpgi.1994.266.4.G745. - DOI - PubMed
    1. Cheung K.S., Chan E.W., Wong A., Chen L., Wong I., Leung W.K. Long-term proton pump inhibitors and risk of gastric cancer development after treatment for Helicobacter pylori: A population-based study. Gut. 2018;67:28–35. doi: 10.1136/gutjnl-2017-314605. - DOI - PubMed

LinkOut - more resources