. 2021 Jun 28;13(7):1261.
doi: 10.3390/v13071261.

Investigation of Salmonella Phage-Bacteria Infection Profiles: Network Structure Reveals a Gradient of Target-Range from Generalist to Specialist Phage Clones in Nested Subsets

Affiliations

Investigation of Salmonella Phage-Bacteria Infection Profiles: Network Structure Reveals a Gradient of Target-Range from Generalist to Specialist Phage Clones in Nested Subsets

Khatuna Makalatia et al. Viruses. .

Abstract

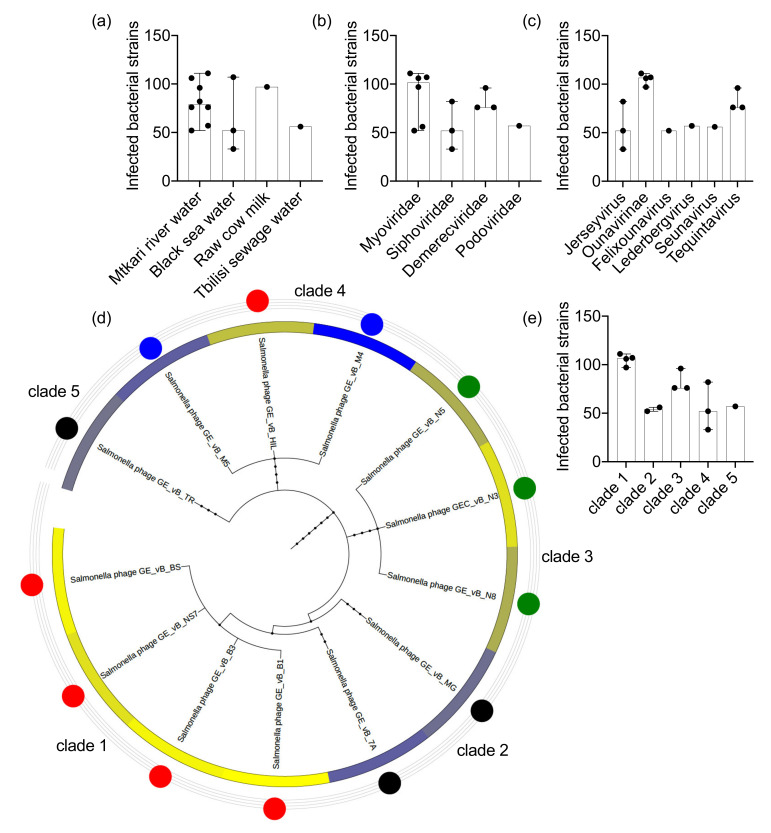
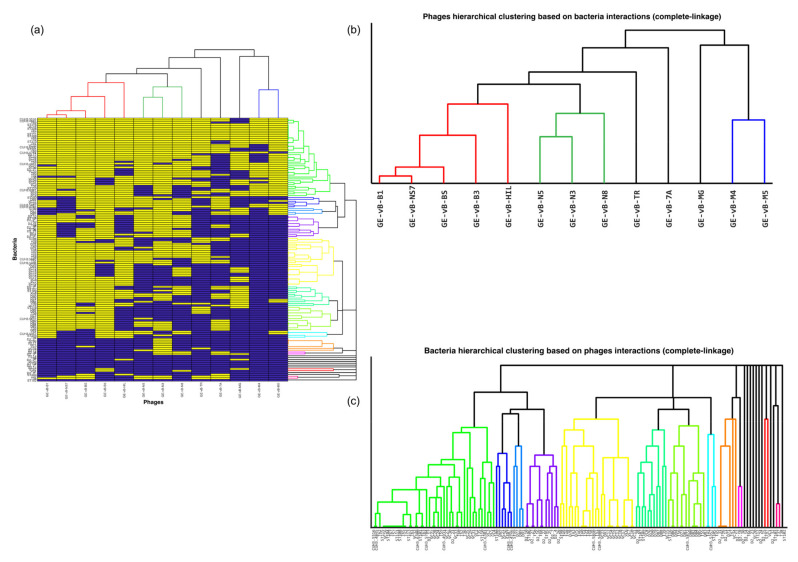
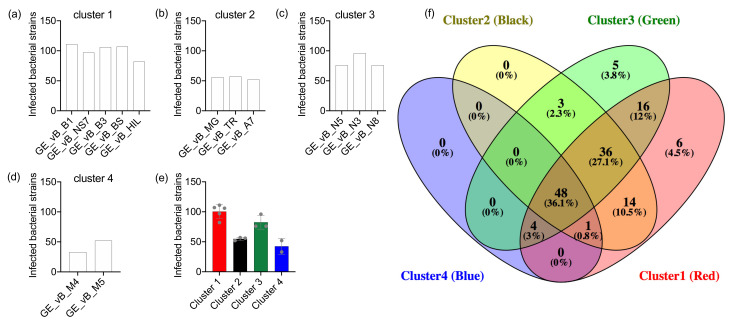
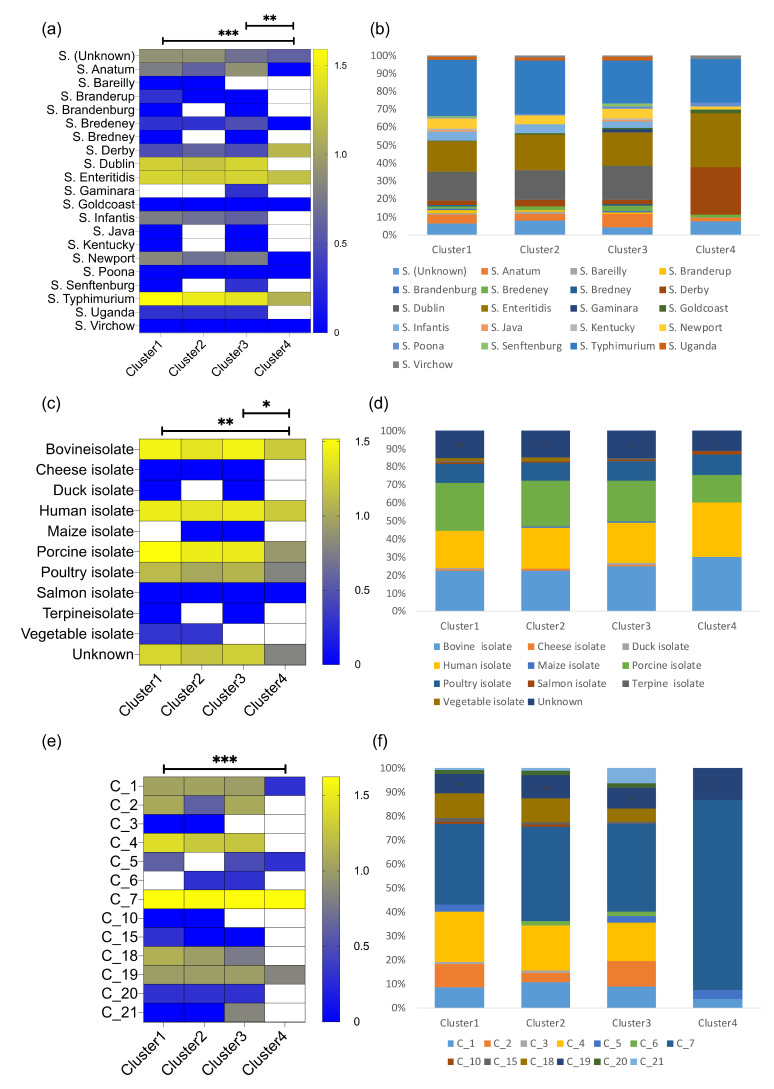
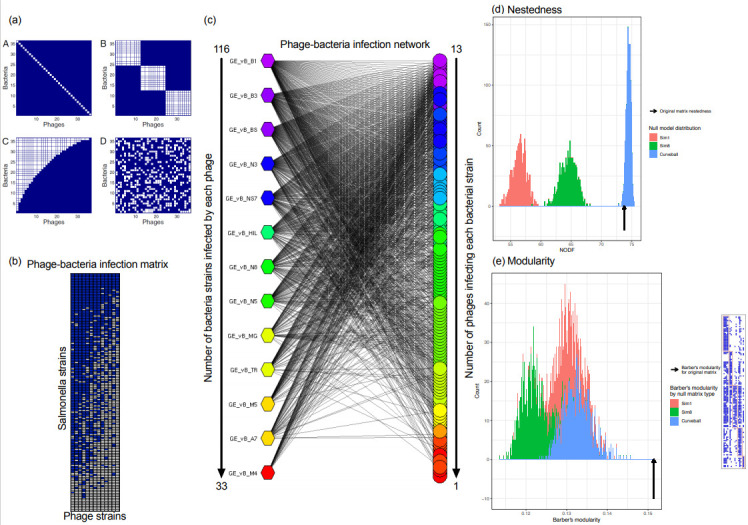
Bacteriophages that lyse Salmonella enterica are potential tools to target and control Salmonella infections. Investigating the host range of Salmonella phages is a key to understand their impact on bacterial ecology, coevolution and inform their use in intervention strategies. Virus-host infection networks have been used to characterize the "predator-prey" interactions between phages and bacteria and provide insights into host range and specificity. Here, we characterize the target-range and infection profiles of 13 Salmonella phage clones against a diverse set of 141 Salmonella strains. The environmental source and taxonomy contributed to the observed infection profiles, and genetically proximal phages shared similar infection profiles. Using in vitro infection data, we analyzed the structure of the Salmonella phage-bacteria infection network. The network has a non-random nested organization and weak modularity suggesting a gradient of target-range from generalist to specialist species with nested subsets, which are also observed within and across the different phage infection profile groups. Our results have implications for our understanding of the coevolutionary mechanisms shaping the ecological interactions between Salmonella phages and their bacterial hosts and can inform strategies for targeting Salmonella enterica with specific phage preparations.

Keywords: bacteria; bacteriophages; evolution; infection; modularity; nestedness; network; salmonella; speciation; virus.


Conflict of interest statement

The authors declare no competing interest.

Figures

Figure 1
Figure 1
Salmonella phages target-range. The number of phage-infected Salmonella bacteria strains are presented according to the phage (a) environmental source, (b) taxonomic family, (c) taxonomic genus, (d) taxonomic lineage, and (e) taxonomic clade. The Salmonella phage taxonomic tree in (e) includes a circular heatmap which is analogous to the absolute number of infected bacterial strains (log10 transformed) and the colored nodes represent the phage infection profile cluster that each phage was assigned to (see Figure 2); red: cluster 1, black: cluster 2, green: cluster 3, and blue: cluster 4.
Figure 2
Figure 2
Salmonella phage–bacteria infection profiles and clustering. (a) Binary heatmap of the Salmonella phage–bacteria infection matrix representing positive (yellow) and negative (blue) in vitro infections. The matrix is organized according to the unsupervised hierarchical agglomerative clustering of the Jaccard similarity amongst the viral species (horizontal) (b) and the bacterial strains (vertical) (c). Strains and species with similar infection preferences (profiles) are positioned closer together in the cladograms in a bottom-up organization.
Figure 3
Figure 3
Target-range of Salmonella phages in different phage infection profile clusters. The number of infected Salmonella bacteria strains per each phage are presented for (a) cluster 1, (b) cluster 2, (c) cluster 3, and (d) cluster 4. (e) The number of infected Salmonella bacteria strains per phage cluster: Median values and 95%CIs are presented. (f) Venn diagram of phage-target overlap amongst phage clusters.
Figure 4
Figure 4
Clusters of Salmonella phage infection profiles. The infection profiles for each Salmonella phage cluster are presented based on three factors: (a,b) the type of Salmonella bacteria species that were infected, (c,d) the type of environmental isolates of the bacteria, and (e,f) the infection cluster that the bacteria belonged to. For each factor the absolute number of infected Salmonella strains is presented in a heatmap format (a,c,e), as well as stacked bar plots representing compositional infection profiles (b,d,f). Heatmap color is analogous to the log10 transformed number of absolute counts of successful infections (high—yellow to low—blue). Significant differences were observed amongst clusters 1 and 4, and 3 and 4. Significance tests: * p < 0.05, ** p < 0.001, *** p < 0.0001.
Figure 5
Figure 5
Investigation of the structure of the Salmonella phage–bacteria infection network. (a) Expected host–phage interaction matrices (adopted by [8]). Bacteria–phage interactions can be (a) A—unique; B—modular; C—nested; D—random. (b) The Salmonella phage–bacteria infection matrix (PBIM): Rows—Salmonella bacterial strains arranged with decreasing order based on the number of different phage species that can be infected by. Columns—phage species arranged with decreasing order based on the number of different Salmonella bacterial strains that can infect. Color coding: blue—infection, white—no infection. (c) The Salmonella PBIN; the network is arranged in accordance with the data from the PBIM. Circular nodes—Salmonella bacterial strains; polygonal nodes—phage species. Color coding—high (pink) to low (red) number of interactions (infections). Color coding refers to phage and bacterial node degree (number of successful infections), respectively. (d) Analysis of nestedness in the Salmonella PBIN. Distributions of nestedness scores (NODF) for the three null models (1200 simulations each) are shown, with the arrow indicating the score for the observed matrix. A NODF score for the observed matrix greater than 95% of the null matrix scores indicates the observed data is significantly nested (p < 0.05). Null models: red—Sim1; green—Sim 8; blue—Curveball. (e) Analysis of modularity in the Salmonella PBIN. Distributions of modularity scores for the three null models (1200 simulations each) are shown, with the arrow indicating the score for the observed matrix. A modularity score for the observed matrix greater than 95% of the null matrix scores indicates the observed data is significantly modular (p < 0.05). Matrix visualization of the module assignment giving the highest modularity score. Red—Sim1; green—Sim 8; blue—Curveball.

Similar articles

Cited by

References

    1. World Health Organization Salmonella (Non-Typhoidal). Newsroom. [(accessed on 6 April 2021)];2018 Available online: https://www.who.int/news-room/fact-sheets/detail/salmonella-(non-typhoidal)
    1. Centers for Disease Control and Prevention Salmonella. [(accessed on 6 May 2021)]; Available online: https://www.cdc.gov/salmonella/index.html.
    1. Wang X., Biswas S., Paudyal N., Pan H., Li X., Fang W., Yue M. Antibiotic Resistance in Salmonella Typhimurium Isolates Recovered from the Food Chain Through National Antimicrobial Resistance Monitoring System Between 1996 and 2016. Front. Microbiol. 2019;10:985. doi: 10.3389/fmicb.2019.00985. - DOI - PMC - PubMed
    1. Chanishvili N. Literature Review of the Practical Application of Bacteriophage Research. George Eliava Institute of Bacteriophage, Microbiology and Virology; Tbilisi, Georgia: Nova Science Publishers; Hauppauge, NY, USA: 2012. Bacteriology Research Developments, Virology Research Progress.
    1. Chanishvili N. Bacteriophages as Therapeutic and Prophylactic Means: Summary of the Soviet and Post Soviet Experiences. Curr. Drug Deliv. 2016;13:309–323. doi: 10.2174/156720181303160520193946. - DOI - PubMed

Publication types

MeSH terms

Substances