. 2021 Jun 15;13(12):3002.
doi: 10.3390/cancers13123002.

From Sampling to Sequencing: A Liquid Biopsy Pre-Analytic Workflow to Maximize Multi-Layer Genomic Information from a Single Tube

Affiliations

From Sampling to Sequencing: A Liquid Biopsy Pre-Analytic Workflow to Maximize Multi-Layer Genomic Information from a Single Tube

Kendra K Maass et al. Cancers (Basel). .

Abstract

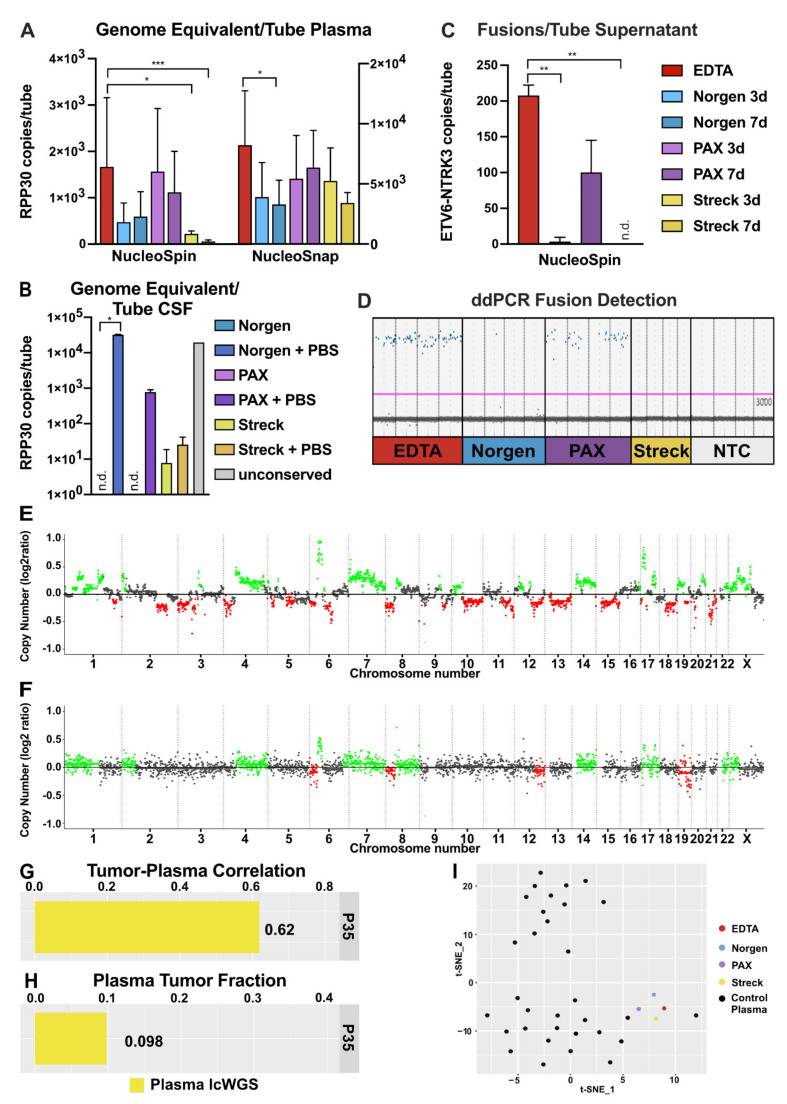
Liquid biopsies hold great promise for the management of cancer. Reliable liquid biopsy data depend on stable and reproducible pre-analytical protocols that comply with quality measures, irrespective of the sampling and processing site. We established a workflow for plasma preservation, followed by processing, cell-free nucleic acid isolation, quantification, and enrichment of potentially tumor-derived cell-free DNA and RNA. Employing the same input material for a direct comparison of different kits and protocols allowed us to formulate unbiased recommendations for sample collection, storage, and processing. The presented workflow integrates the stabilization in Norgen, PAX, or Streck tubes and subsequent parallel isolation of cell-free DNA and RNA with NucleoSnap and NucleoSpin. Qubit, Bioanalyzer, and TapeStation quantification and quality control steps were optimized for minimal sample use and high sensitivity and reproducibility. We show the efficiency of the proposed workflow by successful droplet digital PCR amplification of both cell-free DNA and RNA and by detection of tumor-specific alterations in low-coverage whole-genome sequencing and DNA methylation profiling of plasma-derived cell-free DNA. For the first time, we demonstrated successful parallel extraction of cell-free DNA and RNA from plasma samples. This workflow paves the road towards multi-layer genomic analysis from one single liquid biopsy sample.

Keywords: CSF; blood preservation tubes; cancer; cell-free DNA; cell-free RNA; droplet digital PCR; liquid biopsy; low-coverage whole-genome sequencing; pre-analytics; size selection.


Conflict of interest statement

The authors declare no conflict of interest.

Figures

Figure 1
Figure 1
Comparative analysis of blood conservation tubes. (A) Representative images of blood collected in EDTA, PAX, Norgen, and Streck tubes at the same time point from the same healthy donor for a direct comparison of tube performance. Pictures were taken right after blood drawing (left), after 3 d (middle left), after 7 d (middle right), and after plasma processing by centrifugation (right). (B) Mean plasma volumes obtained from indicated blood conservation tubes after centrifugation (n = 4). ** p < 0.01, **** p < 0.0001 as determined by Kruskal–Wallis test (C) The mean concentration of cfDNA recovered from indicated tubes isolated by NucleoSnap quantified on Bioanalyzer profile (BA). The size of DNA wrapped around one nucleosome can range from around 146 to 176 bp and is represented by 160 bp (n = 4). (D) cfDNA yield per plasma volume calculated for the different tubes. Concentration is defined as cfDNA (160 bp, measured by BA) per plasma volume (n = 4). (E,F) Mean Qubit concentration of total DNA (E) and total RNA (F) recovered from indicated tubes isolated by NucleoSpin (left) or NucleoSnap (right). n.d. indicates not detectable values. When no specific time point is indicated, values represent the mean of both time points (n = 4).
Figure 2
Figure 2
Strategies for CSF conservation in blood preservation tubes. (A) Concentration of total DNA recovered from 1.5 mL CSF of a brain tumor patient conserved in the indicated tube type. DNA was isolated with NucleoSpin, and the DNA concentration was measured by Qubit. (B) The concentration of cfDNA (first nucleosomal peak, 160 bp) recovered from 1.5 mL CSF of a brain tumor patient conserved in the indicated tube for preservation and isolated by NucleoSpin. The concentration was determined by measuring the first peak of the Bioanalyzer profile (BA). n.d. indicates not detectable values. (C) BA profiles for DNA isolated from CSF of a brain tumor patient after 7 d unconserved (gray), in a Norgen tube (light blue), and a Norgen tube filled up with PBS before centrifugation (dark blue). (D) cfDNA purity of DNA isolations from unconserved CSF and CSF collected in a Norgen tube that was filled up with PBS. Purity was defined as the ratio of cfDNA (first nucleosomal peak, 160 bp) to total DNA (50–7000 bp) measured by BA.
Figure 3
Figure 3
Comparative evaluation of cell-free DNA isolation kit performance concerning yield and purity. (A) Direct, paired comparison of QIAamp DNA Blood Mini Kit (QB, green), QIAamp Circulating Nucleic Acid Kit (QNA, light blue), and QIAamp MinElute ccfDNA Mini Kit (QME, dark blue) isolation kits on plasma aliquots of pediatric cancer patients (n = 7). Cell-free DNA (cfDNA) yields are depicted as the concentration of cfDNA in the first nucleosome peak (160 bp) measured by Bioanalyzer (BA) per millilter of plasma. (B) cfDNA purity was defined as the ratio of cfDNA (first nucleosomal peak, 160 bp) to total DNA (50–7000 bp) measured by BA. QB= 0.05; QNA= 0.668; QME= 0.582. (C) Plasma aliquots of pediatric cancer patients were isolated with QNA and QME for direct comparison. Logarithmic representation of cfDNA yields measured as first nucleosomal peak (160 bp) by BA. Boxplot shows median and interquartile range, whiskers represent 10th–90th percentiles (n = 16, p = 0.13). ns denotes differences in means that were not significant as determined by Wilcoxon signed-rank test. (D) Representative BA profiles of one plasma sample (P2 cf. Figure 3A) isolated with QB (green), QNA (light blue), and QME (dark blue). (E) Representative BA profiles of one plasma sample (P15 cf. Figure 3F) isolated with QME (dark blue) and NucleoSnap (red). (F,G) Direct comparison of QME and NucleoSnap isolation kit performance for plasma aliquots of pediatric cancer patients. (F) cfDNA yields measured with BA are depicted as the concentration of cfDNA (first nucleosomal peak, 160 bp) per milliliter of plasma. (G) Logarithmic representation of cfDNA yields (first nucleosomal peak, 160 bp) by BA. Boxplot shows median and interquartile range, whiskers represent 10th–90th percentiles (n = 29, p = 0.0005). *** p < 0.001 as determined by Wilcoxon signed-rank test.
Figure 4
Figure 4
Evaluation of sensitivity and reproducibility of DNA quantification methods in low concentration range. (A,B) Correlation of expected to measured concentration of genomic DNA (gDNA) and cell-free DNA (cfDNA) quantified by fluorometric measurement methods (n = 5). (A) gDNA and cfDNA concentration in the range of 2.5–25 ng/µL. (B) The range of 0–1.5 ng/µL is indicated only for cfDNA values. (C,D) Quantification of cfDNA by electrophoretic quantification methods. (C) cfDNA of indicated concentrations were run on TapeStation cfDNA screen tapes and quantified for the peak region. (D) cfDNA of indicated concentrations were run on Bioanalyzer (BA) chip and the observed peaks were quantified. (E) Overlay of corresponding TapeStation cfDNA profiles of indicated concentration (0.02–2.8 ng) quantified in (C). In the upper right corner: zoom-in of the TapeStation profiles ≤ 700 pg. (F) Overlay of corresponding BA cfDNA profiles of indicated concentrations (0.0–21.4 ng) quantified in (D). In the upper right corner: zoom-in of the BA profiles ≤ 700 pg. All whiskers represent the standard deviation of technical replicates.
Figure 5
Figure 5
Size selection strategies for specific enrichment of cell-free DNA. (A) Bioanalyzer (BA) profile of DNA HS ladder with defined peak sizes serving as input for size selection. (B) DNA ladder from (A) after performing right side size selection. 0.6× bead bound eluate loaded. (C) DNA ladder from (A), with small DNA being in the 0.6× supernatant. Small fragments were bound in a second step by a 2.0× bead ratio and subsequently eluted. (D) cfDNA of P35 isolated with QIAamp MinElute ccfDNA Mini Kit (QME) was subjected to size selection. DNA profile before (light blue) and after size selection (pink) employing the 0.6x bead ratio to separate cfDNA from larger DNA fragments. (E) Quantification of total DNA (pink) by Qubit measurement and of cfDNA peaks (160–480 bp, light green) and total DNA (region 50–7000 bp, black) by BA measurement before and after size selection.
Figure 6
Figure 6
Cell-free nucleic acid validation after application of the improved pre-analytical protocol. (A) Genome equivalents represented as copies of the non-amplified genome region RPP30 per indicated plasma tube plotted for NucleoSpin (left) and NucleoSnap (right). Error bars indicate standard deviation (n = 4). ** p < 0.01, *** p < 0.001 as determined by Kruskal–Wallis test. (B) Genome equivalents from CSF from indicated tubes represented as copies of the non-amplified genome region RPP30 plotted as copies per tube. Error bars are plotted as a standard deviation from technical replicates (n = 2). n.d. indicates not detectable values. * p < 0.05 as determined by Kruskal–Wallis test. (C) Transcriptome equivalents from cell culture supernatant represented as ETV6-NTRK3-fusion transcripts as copies per tube (n = 4). n.d. indicates not detectable values. ** p < 0.01 as determined by Kruskal–Wallis test. (D) ddPCR data depicting either fusion-positive (blue) or fusion-negative (gray) droplets in the different tubes. (E) Copy number variation (CNV) profile of osteosarcoma tumor DNA obtained from methylation EPIC array and (F) corresponding low-coverage whole-genome sequencing (lcWGS) of plasma collected from patient P35 following application of an optimized cell-free DNA (cfDNA) isolation protocol. (G) Correlation coefficient of the tumor CNV profile and the matching plasma CNV profile from lcWGS (yellow). (H) Estimated tumor fraction representing the relative amount of circulating tumor DNA (ctDNA) in the overall cell-free DNA (cfDNA) pool. (I) cfDNA from one individual stored in different conservation tubes clustered in close proximity when subjected to methylation analysis. T-SNE approach was used for reduction of dimensionality.

References

    1. Heitzer E., Haque I.S., Roberts C.E.S., Speicher M.R. Current and future perspectives of liquid biopsies in genomics-driven oncology. Nat. Rev. Genet. 2019;20:71–88. doi: 10.1038/s41576-018-0071-5. - DOI - PubMed
    1. Kwapisz D. The first liquid biopsy test approved. Is it a new era of mutation testing for non-small cell lung cancer? Ann. Transl. Med. 2017;5:46. doi: 10.21037/atm.2017.01.32. - DOI - PMC - PubMed
    1. Sorenson G.D., Pribish D.M., Valone F.H., Memoli V.A., Bzik D.J., Yao S.L. Soluble normal and mutated DNA sequences from single-copy genes in human blood. Cancer Epidemiol. Biomark. Prev. 1994;3:67–71. - PubMed
    1. Olsson E., Winter C., George A., Chen Y., Howlin J., Tang M.H., Dahlgren M., Schulz R., Grabau D., van Westen D., et al. Serial monitoring of circulating tumor DNA in patients with primary breast cancer for detection of occult metastatic disease. EMBO Mol. Med. 2015;7:1034–1047. doi: 10.15252/emmm.201404913. - DOI - PMC - PubMed
    1. Parkinson C.A., Gale D., Piskorz A.M., Biggs H., Hodgkin C., Addley H., Freeman S., Moyle P., Sala E., Sayal K., et al. Exploratory analysis of tp53 mutations in circulating tumour DNA as biomarkers of treatment response for patients with relapsed high-grade serous ovarian carcinoma: A retrospective study. PLoS Med. 2016;13:e1002198. doi: 10.1371/journal.pmed.1002198. - DOI - PMC - PubMed

LinkOut - more resources