. 2021 Jun 15;9(2):32.
doi: 10.3390/jintelligence9020032.

Bridging Brain and Cognition: A Multilayer Network Analysis of Brain Structural Covariance and General Intelligence in a Developmental Sample of Struggling Learners

Affiliations

Bridging Brain and Cognition: A Multilayer Network Analysis of Brain Structural Covariance and General Intelligence in a Developmental Sample of Struggling Learners

Ivan L Simpson-Kent et al. J Intell. .

Abstract

Network analytic methods that are ubiquitous in other areas, such as systems neuroscience, have recently been used to test network theories in psychology, including intelligence research. The network or mutualism theory of intelligence proposes that the statistical associations among cognitive abilities (e.g., specific abilities such as vocabulary or memory) stem from causal relations among them throughout development. In this study, we used network models (specifically LASSO) of cognitive abilities and brain structural covariance (grey and white matter) to simultaneously model brain-behavior relationships essential for general intelligence in a large (behavioral, N = 805; cortical volume, N = 246; fractional anisotropy, N = 165) developmental (ages 5-18) cohort of struggling learners (CALM). We found that mostly positive, small partial correlations pervade our cognitive, neural, and multilayer networks. Moreover, using community detection (Walktrap algorithm) and calculating node centrality (absolute strength and bridge strength), we found convergent evidence that subsets of both cognitive and neural nodes play an intermediary role 'between' brain and behavior. We discuss implications and possible avenues for future studies.

Keywords: brain structural covariance; cognitive network neuroscience; cortical volume; fractional anisotropy; general intelligence; multilayer network analysis.


Conflict of interest statement

E.T.B. is a member of the scientific advisory board of Sosei Heptares.

Figures

Figure 1
Figure 1
(A) Grey matter ROIs based on the Desikan–Killiany atlas (cortical volume, N = 246) in the left and right hemisphere. White matter ROIs based on the John’s Hopkin’s University atlas (fractional anisotropy, N = 165) in (B) transverse plane (superior), (C) coronal plane, and (D) transverse plane (inferior). Note that the frontal pole is not visible in these planes.
Figure 2
Figure 2
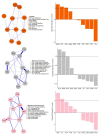
Single-layer partial correlation networks. Top: Network visualization (spring layout, left) of CALM cognitive data (N = 805). Centrality estimates (z-scores) of all cognitive tasks (right). Middle: Network visualization (spring layout, left) of CALM cortical volume data (N = 246). Centrality estimates (z-scores) of all cortical volume nodes (right). Bottom: Network visualization (spring layout, left) of CALM fractional anisotropy data (N = 165). Centrality estimates (z-scores) of all fractional anisotropy nodes (right). Dashed lines in centrality plots indicate mean strength and one standard deviation above the mean.
Figure 3
Figure 3
(Top) Correlation plot for cognitive raw scores and bilateral cortical volume ROIs. (Middle) Correlation plot for cognitive raw scores and bilateral fractional anisotropy ROIs. (Bottom) Correlation plot for bilateral cortical volume and bilateral fractional anisotropy ROIs. All coefficients shown are Pearson correlations. Blue represents positive correlations while red signifies negative correlations among variables. Size of circles indicates the magnitude of the association (e.g., larger circle = higher correlation). Correlations calculated using pairwise complete observations. Abbreviations: matrix reasoning (MR), peabody picture vocabulary test (Pea), spelling (Spell), single word reading (Read), numerical operations (NO), digit recall (DR), backward digit recall (BDR), Mr. X (MrX), dot matrix (Dot), following instructions (Ins), caudal anterior cingulate (CAC), caudal middle frontal gyrus (CMF), medial orbital frontal cortex (MOF), rostral anterior cingulate gyrus (RAC), rostral middle frontal gyrus (RMF), superior frontal gyrus (SFG), superior temporal gyrus (STG), supramarginal gyrus (SMG), frontal pole (FP), transverse temporal gyrus (TTG), anterior thalamic radiations (ATR), corticospinal tract (CST), cingulate gyrus (CING), cingulum (hippocampus) (CINGh), inferior fronto-occipital fasciculus (IFOF), inferior longitudinal fasciculus (ILF), superior longitudinal fasciculus (SLF), uncinate fasciculus (UNC), forceps major (FMaj), and forceps minor (FMin).
Figure 3
Figure 3
(Top) Correlation plot for cognitive raw scores and bilateral cortical volume ROIs. (Middle) Correlation plot for cognitive raw scores and bilateral fractional anisotropy ROIs. (Bottom) Correlation plot for bilateral cortical volume and bilateral fractional anisotropy ROIs. All coefficients shown are Pearson correlations. Blue represents positive correlations while red signifies negative correlations among variables. Size of circles indicates the magnitude of the association (e.g., larger circle = higher correlation). Correlations calculated using pairwise complete observations. Abbreviations: matrix reasoning (MR), peabody picture vocabulary test (Pea), spelling (Spell), single word reading (Read), numerical operations (NO), digit recall (DR), backward digit recall (BDR), Mr. X (MrX), dot matrix (Dot), following instructions (Ins), caudal anterior cingulate (CAC), caudal middle frontal gyrus (CMF), medial orbital frontal cortex (MOF), rostral anterior cingulate gyrus (RAC), rostral middle frontal gyrus (RMF), superior frontal gyrus (SFG), superior temporal gyrus (STG), supramarginal gyrus (SMG), frontal pole (FP), transverse temporal gyrus (TTG), anterior thalamic radiations (ATR), corticospinal tract (CST), cingulate gyrus (CING), cingulum (hippocampus) (CINGh), inferior fronto-occipital fasciculus (IFOF), inferior longitudinal fasciculus (ILF), superior longitudinal fasciculus (SLF), uncinate fasciculus (UNC), forceps major (FMaj), and forceps minor (FMin).
Figure 4
Figure 4
Network visualizations (spring layout) of partial correlation multilayer networks for CALM data. Colors indicate groups determined by the Walktrap algorithm (see above). (Top) Bi-layer networks consisting of cognition and grey matter (top left), and cognition and white matter (top right). (Bottom) Tri-layer network consisting of cognition, grey matter, and white matter (center).
Figure 5
Figure 5
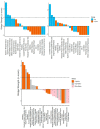
Bridge centrality estimates (z-scores) for multilayer networks. (Top) Bi-layer networks consisting of cognition and grey matter (top left), and cognition and white matter (top right). (Bottom) Tri-layer network consisting of cognition, grey matter, and white matter (center). Dashed lines indicate mean strength and one standard deviation above the mean.

References

    1. Akarca Danyal, Vértes Petra E., Bullmore Edward T., the CALM Team. Astle Duncan E. A Generative Network Model of Neurodevelopment. BioRxiv. 2020 doi: 10.1101/2020.08.13.249391. - DOI
    1. Alexander-Bloch Aaron, Giedd Jay N., Bullmore Ed. Imaging Structural Co-Variance between Human Brain Regions. Nature Reviews Neuroscience. 2013;14:322–36. doi: 10.1038/nrn3465. - DOI - PMC - PubMed
    1. Alloway Tracy P. Automated Working Memory Assessment (AWMA) Harcourt Assessment; London: 2007.
    1. Amestoy Patrick R., Azzalini Adelchi, Badics Tamas, Benison Gregory, Bowman Adrian, Böhm Walter, Briggs Keith, Bruggeman Jeroen, Buchmueller Juergen, Butts Carter T., et al. Igraph: Network Analysis and Visualization (Version 1.2.6) [(accessed on 11 June 2021)];2020 Available online: https://CRAN.R-project.org/package=igraph.
    1. Avants Brian B., Epstein Charles L., Grossman Murray, Gee James C. Symmetric Diffeomorphic Image Registration with Cross-Correlation: Evaluating Automated Labeling of Elderly and Neurodegenerative Brain. Medical Image Analysis. 2008;12:26–41. doi: 10.1016/j.media.2007.06.004. - DOI - PMC - PubMed

LinkOut - more resources