. 2021 Jun 17;11(6):1807.
doi: 10.3390/ani11061807.

Alterations in the Fecal Microbiome and Metabolome of Horses with Antimicrobial-Associated Diarrhea Compared to Antibiotic-Treated and Non-Treated Healthy Case Controls

Affiliations

Alterations in the Fecal Microbiome and Metabolome of Horses with Antimicrobial-Associated Diarrhea Compared to Antibiotic-Treated and Non-Treated Healthy Case Controls

Carolyn Arnold et al. Animals (Basel). .

Abstract

Diarrhea is an adverse effect of antimicrobial therapy in horses. This matched, case-controlled study compared the fecal microbiome and metabolome of horses on antibiotics that developed diarrhea (AAD, n = 17) to those that did not develop diarrhea (ABX, n = 15) and to a control population not exposed to antibiotics (CON, n = 31). Fecal samples were collected from horses that were matched for diet and antimicrobial agent (including dose, route, and duration of therapy). Illumina sequencing of 16S rRNA genes was performed, and QIIME 2.0 was used to generate alpha and beta diversity metrics. Untargeted metabolomics using GC-MS platforms was performed and analyzed using Metaboanalyst 5.0. Microbiome composition was significantly different in AAD compared to CON (ANOSIM, R = 0.568, p = 0.001) but not to ABX (ANOSIM, R = 0.121, p = 0.0012). AAD and ABX horses had significantly decreased richness and evenness compared to CON horses (p < 0.05). Horses on antimicrobials (AAD and ABX) had significant changes in 14 phyla compared to CON horses. Only Verrucomicrobia distinguished AAD from ABX and CON horses (q = 0.0005). Metabolite profiles of horses with AAD clustered separately from ABX and CON horses. Seven metabolites were found to be significantly different between groups (p < 0.05): L-tyrosine, kynurenic acid, xanthurenic acid, 5-hydroxyindole-3-acetic acid, docosahexaenoic acid ethyl ester, daidzein, and N-acetyltyramine. Metabolite profiles of horses on antimicrobials, especially those with AAD, are altered compared to CON horses.

Keywords: antimicrobial-associated diarrhea; colitis; metabolome; microbiota.


Conflict of interest statement

The authors declare no conflict of interest.

Figures

Figure 1
Figure 1
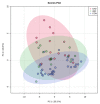
Principal coordinate analysis plot of weighted Unifrac distances horses with antimicrobial-associated diarrhea (AAD, red spheres), antibiotic control horses (ABX, blue spheres), and control horses (CON, yellow spheres). The microbial community composition of horses with AAD compared to CON horses was considered significantly different (R = 0.568, p = 0.001). Horses in the ABX group were different with some overlap from CON horses (R = 0.3, p = 0.001), and AAD and ABX horses were considered similar with high amounts of overlap (R = 0.121, p = 0.012).
Figure 2
Figure 2
Alpha diversity metrics of horses with antimicrobial-associated diarrhea (AAD), antibiotic control horses (ABX), and control horses (CON). AAD and ABX horses show a decreased richness and evenness compared to CON horses but showed no significant difference between each other. Antibiotic use is denoted by color: doxycycline (blue), ceftiofur (green), procaine penicillin G/gentamycin (red), procaine penicillin G/gentamycin/doxycycline (orange), procaine penicillin G/gentamycin/metronidazole (purple), trimethoprim sulfonamide (yellow), and none (black). (A) ASV, (B) Chao1, (C) Shannon.
Figure 3
Figure 3
The median abundance of bacteria in the feces of horses with antimicrobial-associated diarrhea (AAD), antibiotic control horses (ABX), and control horses (CON). * denotes significant differences (p < 0.05) between groups.
Figure 4
Figure 4
Linear discriminant analysis effect size (LEfSe) analysis at the (A) phylum and (B) family levels in horses with antimicrobial-associated diarrhea (AAD, red bars), antibiotic control horses (ABX, blue bars), and control horses (CON, gray bars).
Figure 4
Figure 4
Linear discriminant analysis effect size (LEfSe) analysis at the (A) phylum and (B) family levels in horses with antimicrobial-associated diarrhea (AAD, red bars), antibiotic control horses (ABX, blue bars), and control horses (CON, gray bars).
Figure 5
Figure 5
Scatter plots of the median abundance of phyla found to be significantly different after linear discriminant analysis effect size (LEfSe) analysis. Horses with antimicrobial-associated diarrhea (AAD) are represented by red spheres, antibiotic control horses (ABX) by blue spheres, and non-antibiotic control horses (CON) by black spheres. (A) Actinobacteria, (B) Armatimonadets, (C) Bacteroidetes, (D) Elusimicrobia, (E) Fibrobacteria, (F) Fusobacteria, (G) Plactomycetes, (H) Spirochaetes, (I) SR1, (J) Synergistes, (K)Tenericutes, (L) TM7, (M) Verrucomicrobia, (N) WPS-2.
Figure 5
Figure 5
Scatter plots of the median abundance of phyla found to be significantly different after linear discriminant analysis effect size (LEfSe) analysis. Horses with antimicrobial-associated diarrhea (AAD) are represented by red spheres, antibiotic control horses (ABX) by blue spheres, and non-antibiotic control horses (CON) by black spheres. (A) Actinobacteria, (B) Armatimonadets, (C) Bacteroidetes, (D) Elusimicrobia, (E) Fibrobacteria, (F) Fusobacteria, (G) Plactomycetes, (H) Spirochaetes, (I) SR1, (J) Synergistes, (K)Tenericutes, (L) TM7, (M) Verrucomicrobia, (N) WPS-2.
Figure 6
Figure 6
Principal component analysis plot (PCA) of horses with antimicrobial-associated diarrhea (AAD, red spheres), antibiotic control horses (ABX, green spheres), and control horses (CON, blue spheres) with shaded areas representing 95% confidence intervals.
Figure 7
Figure 7
Heatmap of the 25 most abundant metabolites found in fecal samples. Each column represents an individual horse, sorted by group (antimicrobial-associated diarrhea or AAD, red; antibiotic control horses or ABX, green; control horses or CON, blue), and each row represents a metabolite. The color of each box indicates an increase (red) or decrease (blue) in metabolite concentration.
Figure 8
Figure 8
Metabolites associated with tryptophan metabolism in the feces of horses with antimicrobial-associated diarrhea (AAD), antibiotic control (ABX), and healthy control horses (CON).
Figure 9
Figure 9
Variable importance plot for random forest evaluation of metabolites in horses with antimicrobial-associated diarrhea (AAD), antibiotic control (ABX), and healthy control horses (CON). Metabolites with the highest mean decrease accuracy (MDA) contributed the most to classification of horses as AAD, ABX, or CON.

References

    1. McGorum B.C., Pirie R.S. Antimicrobial associated diarrhoea in the horse. Part 1: Overview, pathogenesis and risk factors. Equine Vet. Educ. 2009;21:610–616. doi: 10.2746/095777309X476871. - DOI
    1. Weese J., Baptiste K.E., Baverud V., Toutain P.L. Guidelines of antimicrobial use in horses. In: Guardabassi L., Jensen L.B., Kruse H., editors. Guide to Antimicrobial use in Animals. 1st ed. Blackwell Publishing Ltd.; Oxford, UK: 2006. pp. 161–182.
    1. Papich M.G. Antimicrobial therapy for gastrointestinal diseases. Vet. Clin. Equine Pract. 2003;19:645–663. doi: 10.1016/j.cveq.2003.08.009. - DOI - PubMed
    1. Andersson G., Ekman L., Månsson I., Persson S., Rubarth S., Tufvesson G. Lethal complications following administration of oxytetracycline in the horse. Nord. Vet. Med. 1971;23:9–22. - PubMed
    1. Barr B.S., Waldridge B.M., Morresey P.R., Reed S.M., Clark C., Belgrave R., Donecker J.M., Weigel D.J. Antimicrobial-associated diarrhoea in three equine referral practices. Equine Vet. J. 2013;45:154–158. doi: 10.1111/j.2042-3306.2012.00595.x. - DOI - PubMed