. 2021 Jun 12;10(6):950.
doi: 10.3390/antiox10060950.

Implications of Oxidative Stress in Glioblastoma Multiforme Following Treatment with Purine Derivatives

Affiliations

Implications of Oxidative Stress in Glioblastoma Multiforme Following Treatment with Purine Derivatives

Marta Orlicka-Płocka et al. Antioxidants (Basel). .

Abstract

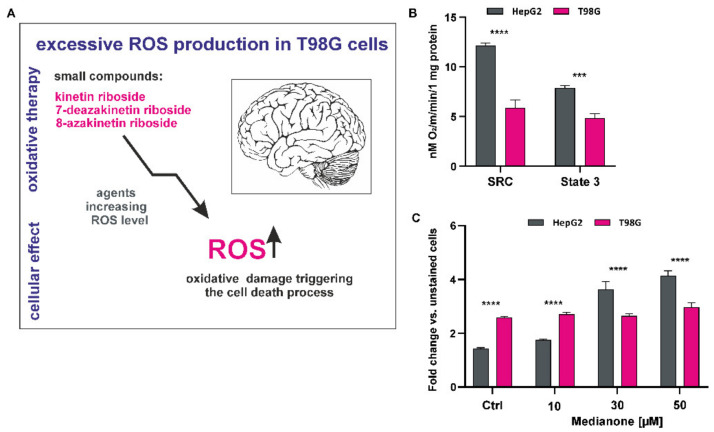
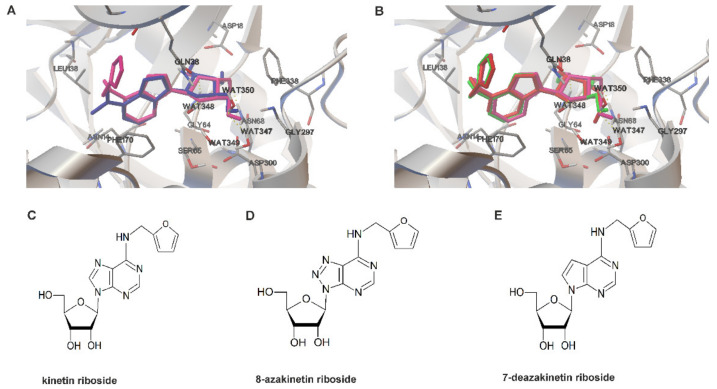
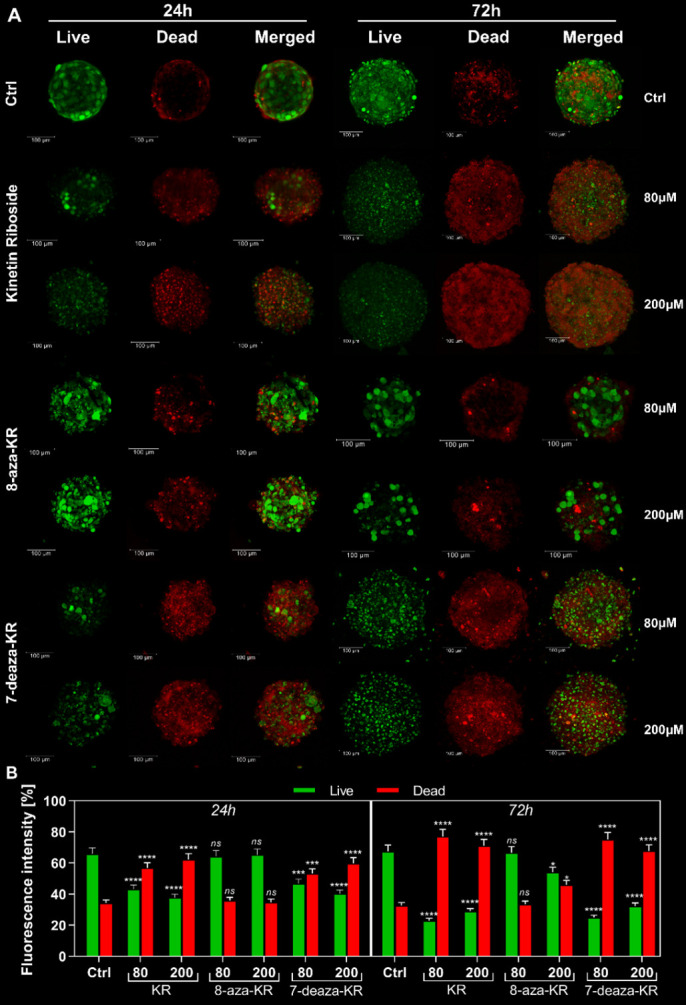
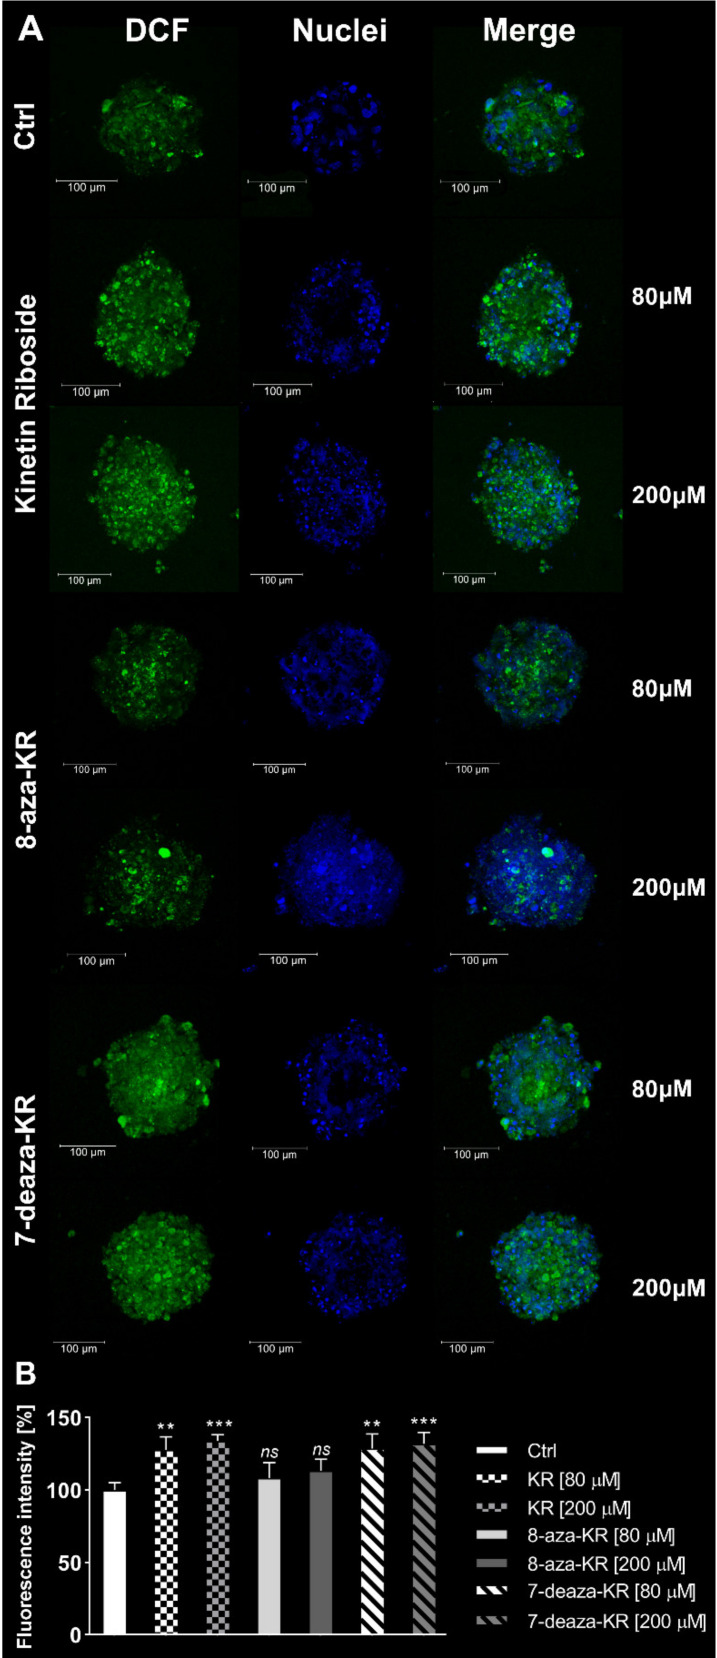
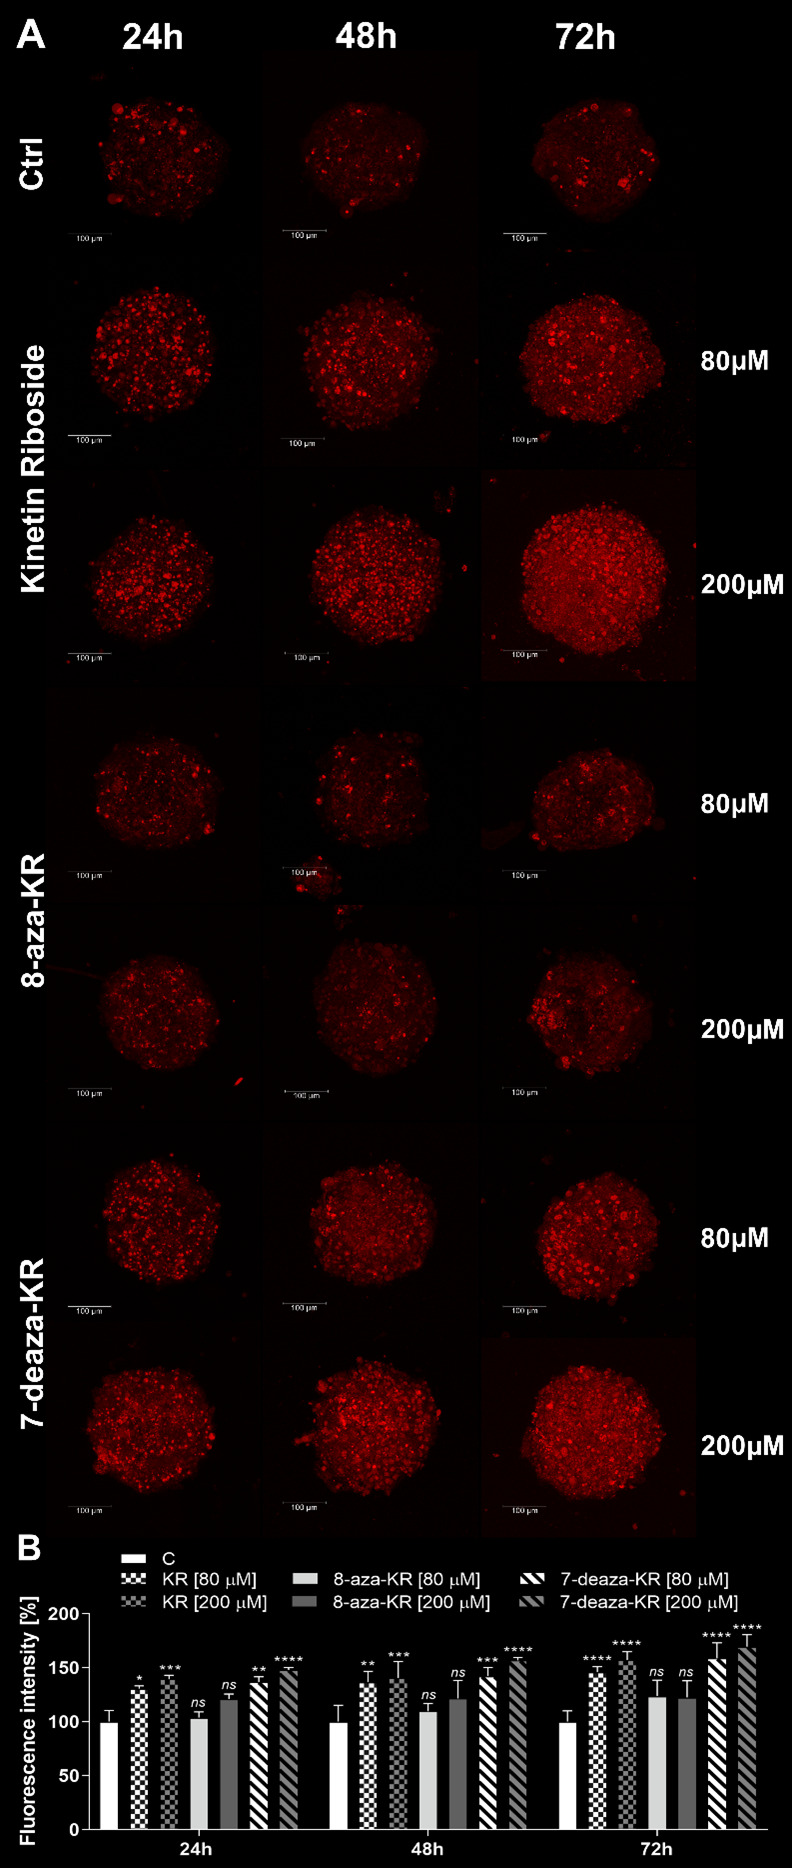
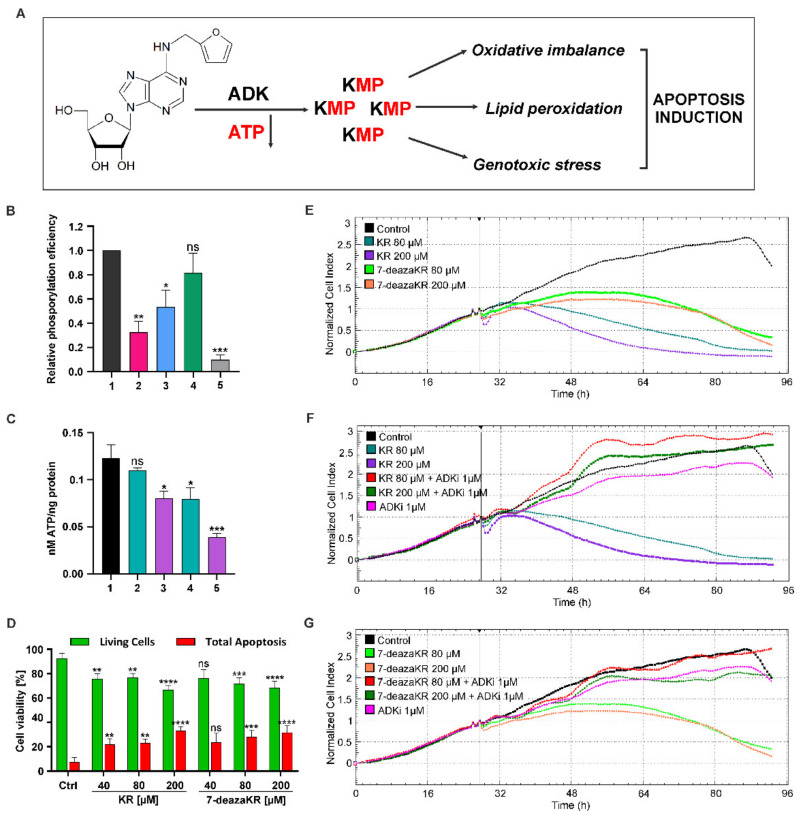
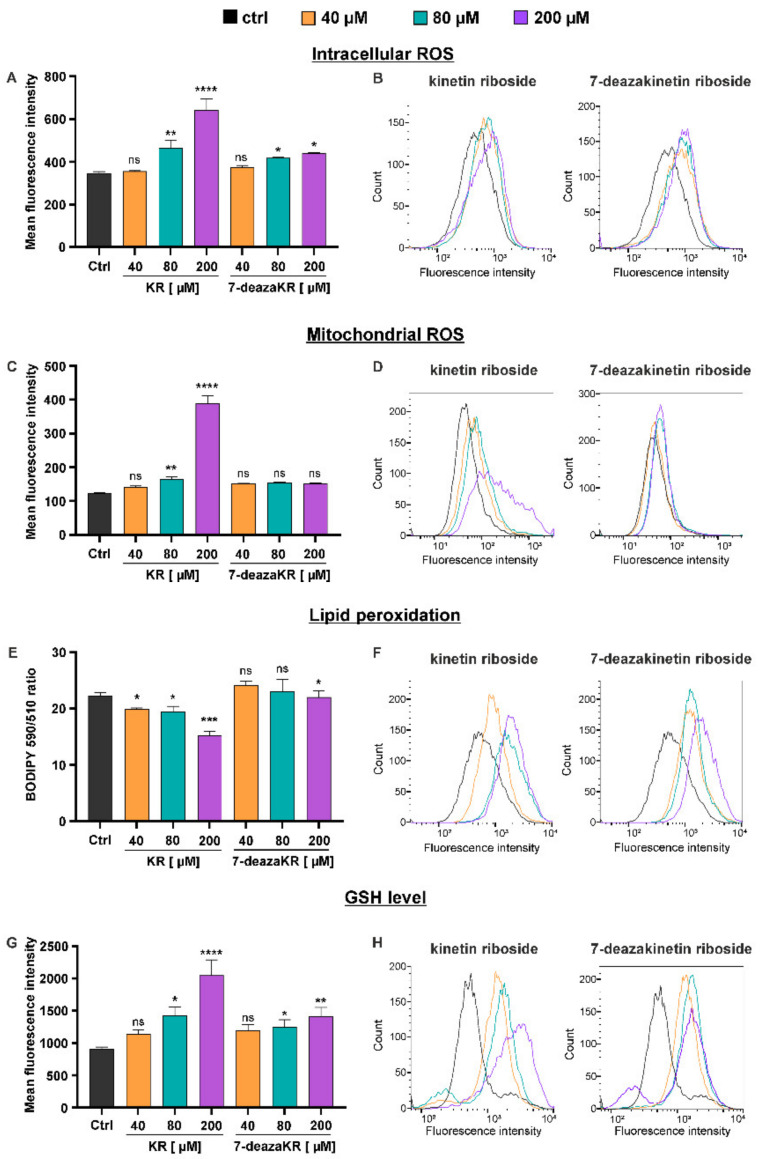
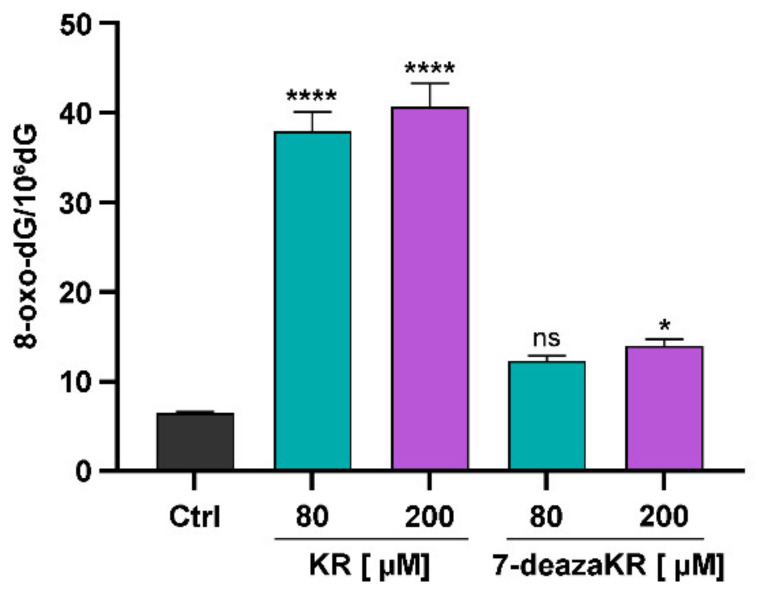
Recently, small compound-based therapies have provided new insights into the treatment of glioblastoma multiforme (GBM) by inducing oxidative impairment. Kinetin riboside (KR) and newly designed derivatives (8-azaKR, 7-deazaKR) selectively affect the molecular pathways crucial for cell growth by interfering with the redox status of cancer cells. Thus, these compounds might serve as potential alternatives in the oxidative therapy of GBM. The increased basal levels of reactive oxygen species (ROS) in GBM support the survival of cancer cells and cause drug resistance. The simplest approach to induce cell death is to achieve the redox threshold and circumvent the antioxidant defense mechanisms. Consequently, cells become more sensitive to oxidative stress (OS) caused by exogenous agents. Here, we investigated the effect of KR and its derivatives on the redox status of T98G cells in 2D and 3D cell culture. The use of spheroids of T98G cells enabled the selection of one derivative-7-deazaKR-with comparable antitumor activity to KR. Both compounds induced ROS generation and genotoxic OS, resulting in lipid peroxidation and leading to apoptosis. Taken together, these results demonstrated that KR and 7-deazaKR modulate the cellular redox environment of T98G cells, and vulnerability of these cells is dependent on their antioxidant capacity.

Keywords: ROS; cancer cells; cell death; glioblastoma multiforme; kinetin riboside; oxidative imbalance; oxidative therapy; purine derivatives; spheroids.


Conflict of interest statement

The authors declare no conflict of interest.

Figures

Figure 1
Figure 1
Aerobic status of glioblastoma (T98G) and non-glioblastoma (HepG2) cells. (A) Involvement of small compounds in the oxidative therapy of T98G cells. (B) Comparison of spare respiration capacity (SRC) and phosphorylating state (state 3) of T98G cells (gray) vs. HepG2 cells (magenta) by using the Oxygraph+ system. (C) Flow cytometry analysis of comparative mitochondrial oxidative stress induction in T98G cells (gray) and HepG2 cells (magenta) after menadione treatment. Fluorescence intensity shift is presented as a bar graph (mean ± SD) of three independent experiments. Statistical significance is indicated with asterisks: *** p < 0.001, **** p < 0.0001.
Figure 2
Figure 2
Determination of kinetin riboside analogues featuring similar affinity for adenosine kinase. (A) Juxtaposition of docked poses of KR (magenta) and the reference ligand dimethyladenosine (blue) in the binding cavity of the modeled semi-open conformation of human ADK structure represented by ribbons. Hydrogen bonds are depicted as yellow dotted lines. Residues in close contact to ligands are shown as sticks. (B) Juxtaposition of docked poses of KR (magenta), 8-azaKR (red), and 7-deazaKR (green) in the binding cavity of the modeled semi-open conformation of human ADK structure represented by ribbons. Hydrogen bonds are depicted as yellow dotted lines. Residues in close contact to ligands are shown as sticks. (CE) Structure of kinetin riboside and its two derivatives, 8-azakinetin riboside and 7-deazakinetin riboside, with similar affinity binding to human ADK.
Figure 3
Figure 3
Viability analysis of T98G spheroids after treatment with KR and 7-deazaKR treatment. (A) Confocal microscopy analysis of the viability of T98G cells in 3D culture by using the LIVE/DEAD assay kit. Green (ex/em: 490/505–550 nm) and red fluorescence (ex/em: 530/600–660 nm) correspond to live and dead cells, respectively. Merged images are shown on the right panels. (B) Analysis of the fluorescence intensity of spheroids. The results are presented as mean ± SD of three independent measurements. Statistical significance (two-way ANOVA): (ns) not significant, * p < 0.05, *** p < 0.001, **** p < 0.0001.
Figure 4
Figure 4
Cellular oxidative stress analysis in T98G 3D cell cultures. (A) Confocal microscopy analysis was performed after 24 h of treatment with 80 and 200 µM of KR and 7-deazaKR. Oxidative stress was determined by H2DCFDA staining (ex/em: 498/505–550 nm). Nuclei were stained with Hoechst 33342 (ex/em: 405/430–480 nm). Connected images are presented on the right panel. (B) Analysis of the shift in the fluorescence intensity of spheroids after treatment. The results are presented as the mean fluorescence intensity ± SD of three measurements. Statistical significance (two-way ANOVA): (ns) not significant, ** p < 0.01, *** p < 0.001.
Figure 5
Figure 5
Mitochondrial oxidative stress analysis in T98G spheroids. (A) Confocal microscopy analysis of the mitochondrial oxidative stress after 24, 48, and 72 h of treatment with KR, 8-azaKR, and 7-deazaKR (80 and 200 µM) determined by MitoSOX staining (ex/em: 510/570–600 nm). (B) Analysis of changes in the fluorescence intensity of spheroids. The results are presented as the mean fluorescence intensity ± SD of three independent experiments. Statistical significance (two-way ANOVA): (ns) not significant, * p < 0.05, ** p < 0.01, *** p < 0.001, **** p < 0.0001.
Figure 6
Figure 6
Kinetin riboside and 7-deazakinetin riboside activity and toxicity in T98G cells depend on ADK activity. (A) Phosphorylation of kinetin riboside by ADK promotes its cellular toxicity, leading to apoptosis induction. (B) In vitro phosphorylation of 7-azaKR (1–4 mM, bars 2–4, respectively) by ADK. The data are presented as the mean ± SD of three independent experiments. Bar 1—positive control of phosphorylation efficiency with 2 mM KR as a substrate. For the negative control, 0.5 mM 5-iodotubercidin was used as an ADK inhibitor (bar 5). (C) Determination of ATP level in the cells after treatment with 80 and 200 µM KR and 7-deazaKR treatment (bars 2–5, respectively) compared to control (bar 1). The results normalized for 1 mg of protein are shown as the mean ± SD from three independent experiments. (D) Flow cytometry analysis of apoptosis/necrosis in T98G cells after 24 h incubation with KR and 7-deazaKR (40–200 µM). (EG) T98G real-time cell proliferation in the presence of KR and 7-deazaKR. The influence of KR and 7-deazaRK (80 and 200 µM) on HepG2 cell proliferation (E) with the addition of an ADK inhibitor (1 µM iodotubercidin; (F,G) was monitored by the xCELLigence system for 120 h at 30 min intervals. The results are representative of at least three independent experiments. Green bars indicate live cells, while red bars represent cells with both early and late apoptosis. The data are presented as the mean percentage ± SD from three independent experiments. Statistical significance is indicated with asterisks: (ns) p > 0.05, * p < 0.05, ** p < 0.01, *** p < 0.001, **** p < 0.0001.
Figure 7
Figure 7
Influence of kinetin riboside and 7-deazakinetin riboside on oxidative stress parameters in T98G cells. (A,B) Intracellular ROS detection in the cells after KR and 7-deazaKR treatment (40–200 µM). ROS production was examined by flow cytometry using H2DCFDA staining, and the fluorescence intensity was estimated. Data are shown as a bar graph of three independent experiments (mean ± SD, A) or as representative histograms (B). (C,D) Flow cytometry analysis of mitochondrial OS induction in T98G cells after KR and 7-deazaKR treatment (40–200 µM) by using the MitoSOX fluorescent indicator. Fluorescence intensity shift was plotted in a bar graph (mean ± SD; C) and is presented as a representative histogram of three independent experiments (D). (E,F) Induction of lipid peroxidation in T98G cells after KR and 7-deazaKR treatment (40–200 µM) analyzed by flow cytometry. Upon oxidation, the emission fluorescence of the BODIPY 581/591 probe shifts from 590 to 510 nm; the 590/510 ratio of fluorescence intensity is presented as a bar graph (mean ± SD) from three individual experiments (E). Fluorescence shift is also shown as representative histograms (F). (G,H) A simultaneous analysis of cellular GSH content measured by staining with the nonfluorescent Thiolite™ Green dye. The fluorescence intensity changes are given in a bar graph of three independent experiments (mean ± SD; (G) or presented as representative histograms (H). Statistical significance is indicated with asterisks: (ns) p > 0.05, * p < 0.05, ** p < 0.01, *** p < 0.001, **** p < 0.0001.
Figure 8
Figure 8
Quantitative analysis of 8-oxo-dG content in T98G cells by HPLC-UV-ED after treatment with KR and 7-deazaKR. The number of 8-oxo-dG residues per 1 × 10⁶ base pairs in DNA was calculated in cells after 24 h incubation with KR and 7-deazaKR (80 and 200 µM). Control cells were cultured in fully supplemented growth medium alone. Statistical significance is indicated with asterisks: (ns) p > 0.05, * p < 0.05, **** p < 0.0001.
Figure 9
Figure 9
The expression level of selected genes analyzed in 2D cell culture of T98G cells treated with KR and 7-deaza-KR at the final concentration of 80 µM. Relative real-time PCR analysis was performed for the genes SOD, CAT, GSS, SESN1, SESN2, NRF2, NFKB, SIRT2, PGC1, PARP, TFA, and p53 24 h after treatment. The results are presented as the mean ± SD obtained from three biological replicates and three independent experimental repeats for each one. Statistical significance (one-way ANOVA): (ns) not significant, * p < 0.05, ** p < 0.01, *** p < 0.001, **** p < 0.0001.

References

    1. Taylor O.G., Brzozowski J., Skelding K.A. Glioblastoma multiforme: An overview of emerging therapeutic targets. Front. Oncol. 2019;9:963. doi: 10.3389/fonc.2019.00963. - DOI - PMC - PubMed
    1. Baillie N., Carr A.C., Peng S. The use of intravenous vitamin C as a supportive therapy for a patient with glioblastoma multiforme. Antioxidants. 2018;7:115. doi: 10.3390/antiox7090115. - DOI - PMC - PubMed
    1. Jia B., Zheng X., Wu M.-L., Tian X.-T., Song X., Liu Y.-N., Li P.-N., Liu J. Increased reactive oxygen species and distinct oxidative damage in resveratrol-suppressed glioblastoma cells. J. Cancer. 2021;12:141–149. doi: 10.7150/jca.45489. - DOI - PMC - PubMed
    1. He C., Zhang Z., Ding Y., Xue K., Wang X., Yang R., An Y., Liu D., Hu C., Tang Q. LRP1-mediated pH-sensitive polymersomes facilitate combination therapy of glioblastoma in vitro and in vivo. J. Nanobiotechnol. 2021;19:29. doi: 10.1186/s12951-020-00751-x. - DOI - PMC - PubMed
    1. Bahadur S., Sahu A.K., Baghel P., Saha S. Current promising treatment strategy for glioblastoma multiform: A review. Oncol. Rev. 2019;13:417. doi: 10.4081/oncol.2019.417. - DOI - PMC - PubMed

LinkOut - more resources