. 2021 Jun 3;9(6):592.
doi: 10.3390/vaccines9060592.

Could a New COVID-19 Mutant Strain Undermine Vaccination Efforts? A Mathematical Modelling Approach for Estimating the Spread of B.1.1.7 Using Ontario, Canada, as a Case Study

Affiliations

Could a New COVID-19 Mutant Strain Undermine Vaccination Efforts? A Mathematical Modelling Approach for Estimating the Spread of B.1.1.7 Using Ontario, Canada, as a Case Study

Mattew Betti et al. Vaccines (Basel). .

Abstract

Infections represent highly dynamic processes, characterized by evolutionary changes and events that involve both the pathogen and the host. Among infectious agents, viruses, such as Severe Acute Respiratory Syndrome-related Coronavirus type 2 (SARS-CoV-2), the infectious agent responsible for the currently ongoing Coronavirus disease 2019 (COVID-2019) pandemic, have a particularly high mutation rate. Taking into account the mutational landscape of an infectious agent, it is important to shed light on its evolution capability over time. As new, more infectious strains of COVID-19 emerge around the world, it is imperative to estimate when these new strains may overtake the wild-type strain in different populations. Therefore, we developed a general-purpose framework to estimate the time at which a mutant variant is able to take over a wild-type strain during an emerging infectious disease outbreak. In this study, we used COVID-19 as a case-study; however, the model is adaptable to any emerging pathogen. We devised a two-strain mathematical framework to model a wild- and a mutant-type viral population and fit cumulative case data to parameterize the model, using Ontario as a case study. We found that, in the context of under-reporting and the current case levels, a variant strain was unlikely to dominate until March/April 2021. The current non-pharmaceutical interventions in Ontario need to be kept in place longer even with vaccination in order to prevent another outbreak. The spread of a variant strain in Ontario will likely be observed by a widened peak of the daily reported cases. If vaccine efficacy is maintained across strains, then it is still possible to achieve high levels of immunity in the population by the end of 2021. Our findings have important practical implications in terms of public health as policy- and decision-makers are equipped with a mathematical tool that can enable the estimation of the take-over of a mutant strain of an emerging infectious disease.

Keywords: COVID-19 pandemic; emerging infectious diseases; mathematical model; mutant strains.


Conflict of interest statement

The funders had no role in the design of the study; in the collection, analyses, or interpretation of data; in the writing of the manuscript, or in the decision to publish the results.

Figures

Figure A1
Figure A1
Figure validating model fitting and scenario building. The model is fit to data from 12 December 2020 to 11 January 2021. We augment the data with data from 12 January 2021 until 7 May 2021. We see that the hybrid data and scenario approach properly detected peaks out to four months in advance. Between January and April 2021, Ontario went through multiple phases of lockdown and relaxation of non-pharmaceutical interventions, which the model does not capture (as they were unknowable at the time). The peak detection makes the model a valuable tool for long-term planning. Thee pink line is the continuation of the fit, the blue line is the new wildtype trajectory when the mutant scenario is introduced, and the dashed line is the mutant strain. The black line is the combination of wildtype and mutant. The black line is the total new cases per day, and this is what should be compared to the data as the new cases per day is reported as a total. The shaded region is the 95% confidence interval from the fit.
Figure A2
Figure A2
Figure 6a augmented with data up to 7 May 2021. The model is still only fit to data up to 11 January 2021. We see that the line fit (cumulative known wildtype cases) is still relatively close 4 months out. As before, green represents the cumulative known cases, purple is the total incidence, red is active mild cases, and blue is active severe cases. Dark lines are mutant compartments, and light colours are wildtype. Dashed lines are the extended scenario, and solid lines the original fit without a separation of wildtype and mutant. The light green line is what is being fit by the model. We see some anomalous behaviours in the extension due to the period of lockdown–relaxation cycles in Ontario. While the log scale obfuscates some detail, the consequence of these lockdown–relaxation cycles not being present in thee model causes an over-estimation on the order of 104 cases.
Figure A3
Figure A3
The model projections from the first wave of COVID-19 in Ontario. The red dots are data not used in the model fitting. The green line is the cumulative known cases, purple is the total incidence, red is active mild cases, and blue is active severe cases. In the right panel (b), we see the new cases per day. We see that the model performs well for at least two weeks when non-pharmaceutical interventions remain relatively constant. The shaded region is the 95% confidence interval from the fit. The 95% confidence interval was able to detect the presence of a second wave in the fall.
Figure 1
Figure 1
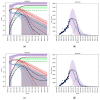
Model fit given different initial conditions for the mutant strain. (Top row, (a,b)) 100 cumulative cases on 26 December 2020. (Bottom row, (c,d)) 1000 cumulative cases on 26 December 2020. (Left column, (a,c)) The active and cumulative cases are shown given the model with (dashed lines) and without (solid lines) the mutant strain (dashed lines). Active mild and severe wildtype infected cases are shown in red and blue. Active and severe mutant infected populations are shown in dark red and dark blue. The cumulative known and total cases of the wildtype and mutant strains are shown in light and dark green, and light and dark purple, respectively. (Right column, (b,d)) The new reported cases per day given the model with (wildtype—solid pink line, mutant—dashed blue line, and total—solid black line) and without (wildtype—solid blue line) the mutant. Ontario reported case data, from September 2020 to January 2021, are also shown (dots).
Figure 2
Figure 2
The proportion of active cases of the mutant strain. (Left) 60 active cases (100 cumulative cases) on 26 December 2020. (Right) 600 active cases (1000 cumulative cases) on 26 December 2020.
Figure 3
Figure 3
Model fit given vaccination and relaxation. (Top row, (a,b)) vaccination without relaxation, (middle row, (c,d)) vaccination with slow relaxation, and (bottom row, (e,f)) vaccination with fast relaxation. Vaccination assumes that 10% of the population is vaccinated by 31 March 2021 and that 75% of the population is inoculated by the end of 2021. Relaxation allows for rules and behaviours to change in a way that allows for more contact between individuals. We assume that behaviours will eventually lead to pre-February 2020 contact rates between individuals. (Left column) The active and cumulative cases are shown given the model with (dashed lines) and without (solid lines) the mutant strain (dashed lines). Active mild and severe wildtype infected cases are shown in red and blue. Active and severe mutant infected populations are shown in dark red and dark blue. The cumulative known and total cases of the wildtype and mutant strains are shown in light and dark green, and light and dark purple, respectively. (Right column) The new reported cases per day given the model with (wildtype—solid pink line, mutant—dashed blue line, and total—solid black line) and without (wildtype—solid blue line) the mutant. Ontario reported case data, from September 2020 to January 2021, are also shown (dots).
Figure 3
Figure 3
Model fit given vaccination and relaxation. (Top row, (a,b)) vaccination without relaxation, (middle row, (c,d)) vaccination with slow relaxation, and (bottom row, (e,f)) vaccination with fast relaxation. Vaccination assumes that 10% of the population is vaccinated by 31 March 2021 and that 75% of the population is inoculated by the end of 2021. Relaxation allows for rules and behaviours to change in a way that allows for more contact between individuals. We assume that behaviours will eventually lead to pre-February 2020 contact rates between individuals. (Left column) The active and cumulative cases are shown given the model with (dashed lines) and without (solid lines) the mutant strain (dashed lines). Active mild and severe wildtype infected cases are shown in red and blue. Active and severe mutant infected populations are shown in dark red and dark blue. The cumulative known and total cases of the wildtype and mutant strains are shown in light and dark green, and light and dark purple, respectively. (Right column) The new reported cases per day given the model with (wildtype—solid pink line, mutant—dashed blue line, and total—solid black line) and without (wildtype—solid blue line) the mutant. Ontario reported case data, from September 2020 to January 2021, are also shown (dots).
Figure 4
Figure 4
The Federal Government vaccine roll-out plan, adapted from [22].
Figure 5
Figure 5
Figure showing the model fit with both the wildtype and mutant. Red is mild cases, blue is severe cases, green is the cumulative reported cases, and purple is the total cases. The light colours are the wildtype, and dark colours are the mutant.
Figure 6
Figure 6
Model fit assuming the period over Christmas to be anomalous, including vaccination and relaxation. Vaccination assumes that 10% of the population is vaccinated by 31 March 2021 and that 75% of the population is inoculated by the end of 2021. Relaxation allows for NPIs to be lifted on 1 May 2021. (Left column, (a)) The active and cumulative cases are shown given the model with (dashed lines) and without (solid lines) the mutant strain (dashed lines). Active mild and severe wild-type infected cases are shown in red and blue. Active and severe mutant infected populations are shown in dark red and dark blue. The cumulative known and total cases of the wild-type and mutant strains are shown in light and dark green, and light and dark purple, respectively. (Right column, (b)) The new reported cases per day given the model with (wild-type—solid pink line, mutant—dashed blue line, and total—solid black line) and without (wild-type—solid blue line) the mutant. Ontario reported case data, from September 2020 to December 2020, are also shown (dots).

References

    1. Heesterbeek H., Anderson R.M., Andreasen V., Bansal S., De Angelis D., Dye C., Eames K.T., Edmunds W.J., Frost S.D., Funk S., et al. Modeling infectious disease dynamics in the complex landscape of global health. Science. 2015;347:aaa4339. doi: 10.1126/science.aaa4339. - DOI - PMC - PubMed
    1. Stern A., Andino R. Viral Pathogenesis. Elsevier; Amsterdam, The Netherlands: 2016. Viral evolution: It is all about mutations; pp. 233–240.
    1. Bonhoeffer S., Nowak M.A. Intra-host versus inter-host selection: Viral strategies of immune function impairment. Proc. Natl. Acad. Sci. USA. 1994;91:8062–8066. doi: 10.1073/pnas.91.17.8062. - DOI - PMC - PubMed
    1. Martins N.E., Faria V.G., Teixeira L., Magalhães S., Sucena É. Host adaptation is contingent upon the infection route taken by pathogens. PLoS Pathog. 2013;9:e1003601. doi: 10.1371/journal.ppat.1003601. - DOI - PMC - PubMed
    1. Duffy S. Why are rna virus mutation rates so damn high? PLoS Biol. 2018;16:e3000003. doi: 10.1371/journal.pbio.3000003. - DOI - PMC - PubMed