. 2021 Jun 3;10(6):500.
doi: 10.3390/biology10060500.

Gene Expression Profiles Associated with Radio-Responsiveness in Locally Advanced Rectal Cancer

Affiliations

Gene Expression Profiles Associated with Radio-Responsiveness in Locally Advanced Rectal Cancer

Jeeyong Lee et al. Biology (Basel). .

Abstract

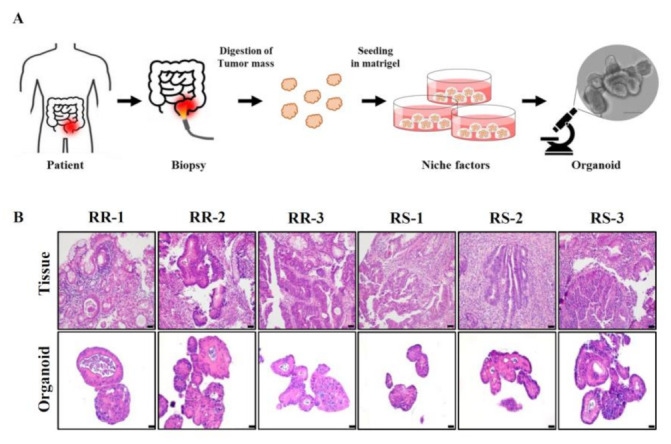
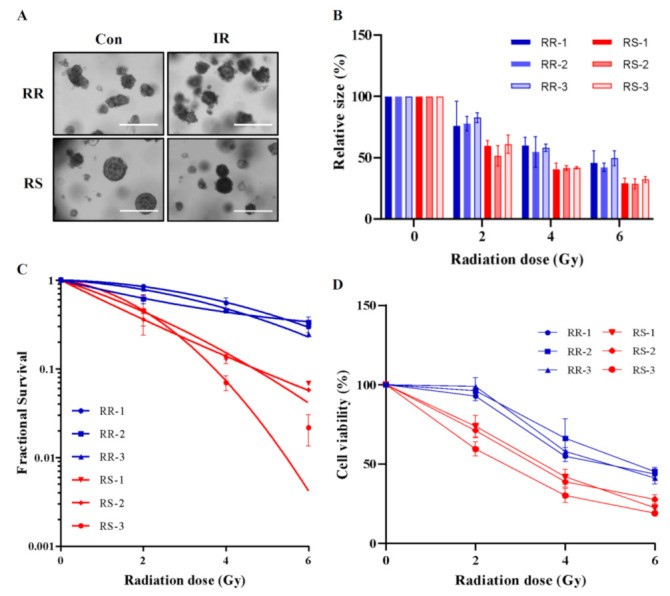
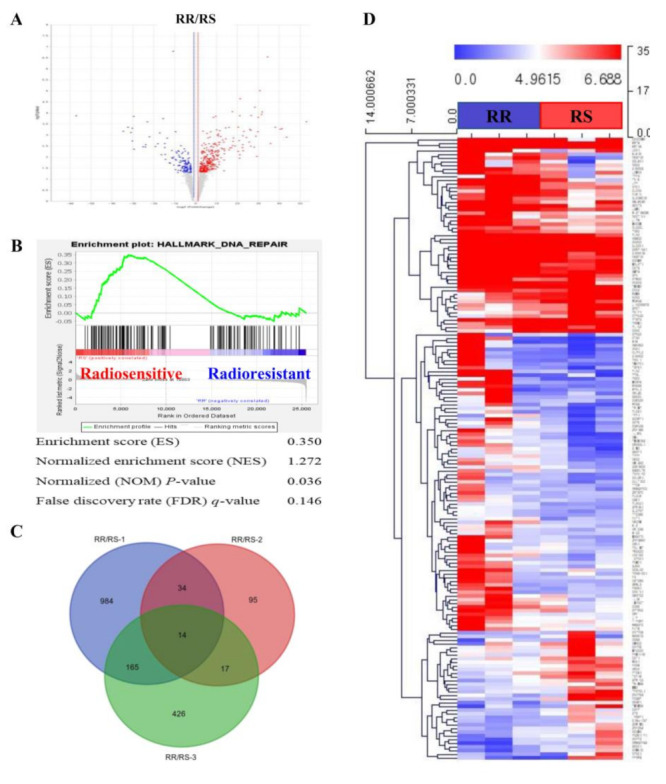
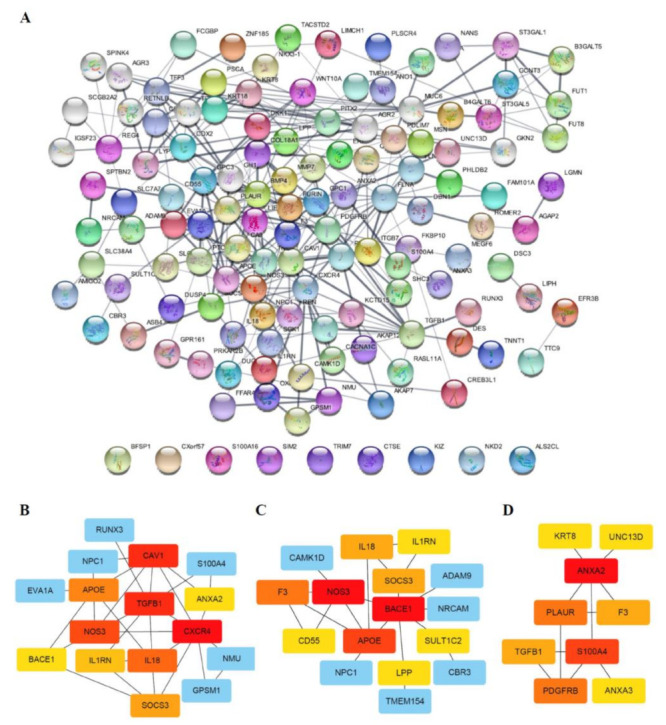
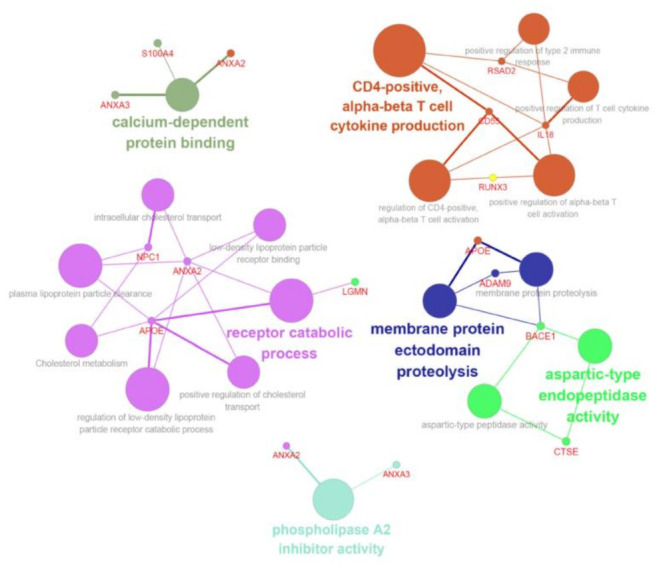
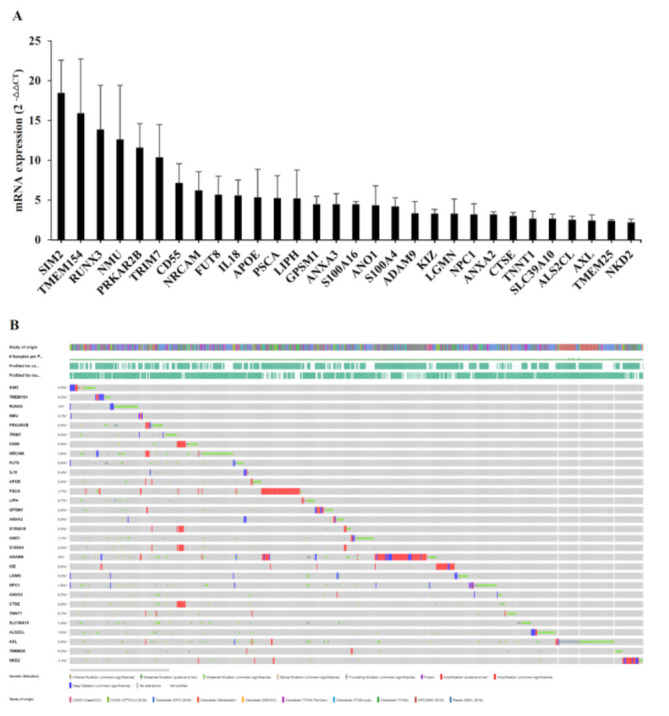
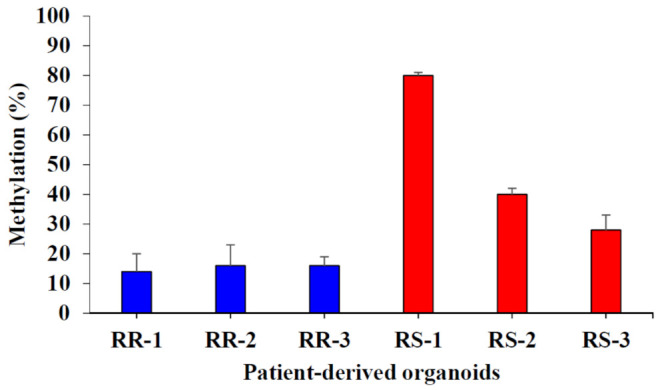
LARC patients were sorted according to their radio-responsiveness and patient-derived organoids were established from the respective cancer tissues. Expression profiles for each group were obtained using RNA-seq. Biological and bioinformatic analysis approaches were used in deciphering genes and pathways that participate in the radio-resistance of LARC. Thirty candidate genes encoding proteins involved in radio-responsiveness-related pathways, including the immune system, DNA repair and cell-cycle control, were identified. Interestingly, one of the candidate genes, cathepsin E (CTSE), exhibited differential methylation at the promoter region that was inversely correlated with the radio-resistance of patient-derived organoids, suggesting that methylation status could contribute to radio-responsiveness. On the basis of these results, we plan to pursue development of a gene chip for diagnosing the radio-responsiveness of LARC patients, with the hope that our efforts will ultimately improve the prognosis of LARC patients.

Keywords: DNA methylation; bio-marker; radiation therapy; radio-responsiveness; rectal cancer.


Conflict of interest statement

The authors declare no conflict of interest. The funders had no role in the design of the study; in the collection, analyses, or interpretation of data; in the writing of the manuscript; or in the decision to publish the results.

Figures

Figure 1
Figure 1
NCRTs cause differential effects in LARC patients. Endoscopic findings (left panels) and magnetic resonance images (right panels) are shown for radioresistant (RR; upper panels) and radiosensitive (RS; lower panels) patients. Pre- and Post-NCRT images are compared. White arrows indicate LARC tissues.
Figure 2
Figure 2
Establishment of LARC patient-derived organoids. (A) A scheme for preparation of patient-derived organoids is shown. (B) Patient-derived organoids and the corresponding primary LARCs are compared using H&E staining. Scale bar: 20 µm.
Figure 3
Figure 3
Patient-derived organoids show differential radio-responsiveness. (A) Brightfield images of RR and RS organoids after 0 Gy and 5 Gy irradiation are shown. Scale bar: 400 μm (B) Changes in the size of the six organoids (RS1–3 and RR1–3) after 0, 2, 4, and 6 Gy irradiation are shown (n = 4 independent experiments). (C) Radiation dose-responses are measured based on survival fraction curves of patient-derived organoids (n = 4 independent experiments). (D) The viability of patient-derived organoids after 0, 2, 4, and 6 Gy irradiation (n = 6 independent experiments) was assessed by MTS assay. Differential expression is considered significant at P < 0.01. Data are normalized to those of control organoids and are presented as mean ± SD.
Figure 4
Figure 4
Analysis of DEGs in patient-derived organoids. (A) Significant DEGs between RR and RS organoids, in the form of log10 (P-value) versus log2 (fold change), are presented graphically as volcano plots. (B) Enrichment plots for GSEA, processed using the expression difference-ranked gene list, shows enrichment of the DNA repair-related gene set. (C) Venn diagram shows the number of differentially expressed genes between RS and RR organoids. (D) Heatmap illustrates significant DEGs between RR (blue bar) and RS (red bar) organoids. Representations of genes were processed using the general linear model likelihood ratio test (P < 0.05 and absolute log2 fold change >1).
Figure 5
Figure 5
PPI network and sub-networks generated from DEGs. (A) The PPI network was processed using the STRING plug-in of the Cytoscape program (version 3.8.2). Each circle represents a gene (node), and connections between circles (edges) represent direct or indirect interactions. Of the 231 genes that were differentially expressed between RR and RS organoids, 130 were functionally linked with 289 edges. PPI enrichment P-values < 0.04 were considered significant. (BD) Module analyses. Module clusters were extracted using MCODE and cytoHubba analyses. Hub genes are indicated in red, and co-expressed genes are indicated in orange, yellow or blue according to their degree of importance. Module 1 (B) contains 16 nodes and 30 edges. Module 2 (C) contains 16 nodes and 20 edges. Module 3 (D) contains 9 nodes and 11 edges.
Figure 6
Figure 6
ClueGo analysis-based enrichment maps derived from GO terms associated with DEGs. Highly interconnected GO terms are presented. Terms in bold font indicate top GO terms. Gene names within subgroups were generated using ClueGO default settings. All GO terms shown are statistically significant (P < 0.05 with Bonferroni correction).
Figure 7
Figure 7
Verification of candidate genes by qRT-PCR and cBioPortal analysis. (A) The graph depicts mRNA levels of candidate genes that are differentially expressed between RR and RS organoids. All candidate genes were significantly upregulated in RR organoids. Differential expression is considered significant at P < 0.05. Error bars indicate standard deviations (n = 3). (B) Candidate genes were queried for genetic alterations in colorectal adenocarcinoma datasets (http://cbioportal.org/ accessed on 11 November 2020). Alterations were found in 0.3% to 3% of the respective analyses and are depicted graphically. Many candidate genes exhibited amplification alterations.
Figure 8
Figure 8
Distinct DNA methylation profiles of the CTSE gene are correlated with the radio-responsiveness of patient-derived organoids. Methylation levels of the CTSE gene in RR and RS organoids were assessed by bisulfite sequencing. Differential expression is considered significant at P < 0.05. Error bars indicate standard deviations (n = 3).

References

    1. Araghi M., Soerjomataram I., Jenkins M., Brierley J., Morris E., Bray F., Arnold M. Global trends in colorectal cancer mortality: Projections to the year 2035. Int. J. Cancer. 2019;144:2992–3000. doi: 10.1002/ijc.32055. - DOI - PubMed
    1. Mishra J., Drummond J., Quazi S.H., Karanki S.S., Shaw J.J., Chen B., Kumar N. Prospective of colon cancer treatments and scope for combinatorial approach to enhanced cancer cell apoptosis. Crit. Rev. Oncol. Hematol. 2013;86:232–250. doi: 10.1016/j.critrevonc.2012.09.014. - DOI - PMC - PubMed
    1. Sauer R., Becker H., Hohenberger W., Rodel C., Wittekind C., Fietkau R., Martus P., Tschmelitsch J., Hager E., Hess C.F., et al. Preoperative versus postoperative chemoradiotherapy for rectal cancer. N. Engl. J. Med. 2004;351:1731–1740. doi: 10.1056/NEJMoa040694. - DOI - PubMed
    1. Sauer R., Liersch T., Merkel S., Fietkau R., Hohenberger W., Hess C., Becker H., Raab H.R., Villanueva M.T., Witzigmann H., et al. Preoperative versus postoperative chemoradiotherapy for locally advanced rectal cancer: Results of the German CAO/ARO/AIO-94 randomized phase III trial after a median follow-up of 11 years. J. Clin. Oncol. 2012;30:1926–1933. doi: 10.1200/JCO.2011.40.1836. - DOI - PubMed
    1. Kapiteijn E., Marijnen C.A., Nagtegaal I.D., Putter H., Steup W.H., Wiggers T., Rutten H.J., Pahlman L., Glimelius B., van Krieken J.H., et al. Preoperative radiotherapy combined with total mesorectal excision for resectable rectal cancer. N. Engl. J. Med. 2001;345:638–646. doi: 10.1056/NEJMoa010580. - DOI - PubMed

LinkOut - more resources