

The Role of Phylogenetics in Discerning HIV-1 Mixing among Vulnerable Populations and Geographic Regions in Sub-Saharan Africa: A Systematic Review
- PMID: 34205246
- PMCID: PMC8235305
- DOI: 10.3390/v13061174
The Role of Phylogenetics in Discerning HIV-1 Mixing among Vulnerable Populations and Geographic Regions in Sub-Saharan Africa: A Systematic Review
Abstract
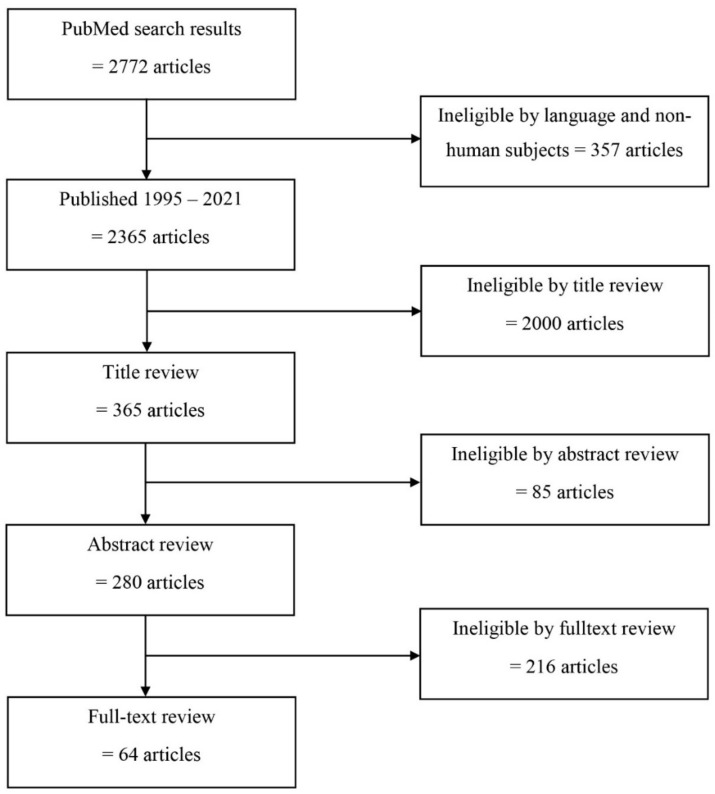
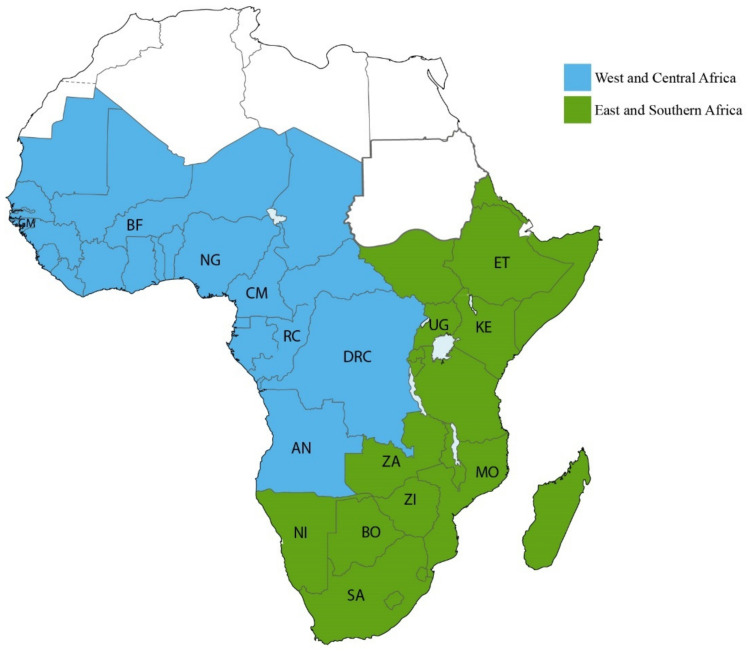
To reduce global HIV-1 incidence, there is a need to understand and disentangle HIV-1 transmission dynamics and to determine the geographic areas and populations that act as hubs or drivers of HIV-1 spread. In Sub-Saharan Africa (sSA), the region with the highest HIV-1 burden, information about such transmission dynamics is sparse. Phylogenetic inference is a powerful method for the study of HIV-1 transmission networks and source attribution. In this review, we assessed available phylogenetic data on mixing between HIV-1 hotspots (geographic areas and populations with high HIV-1 incidence and prevalence) and areas or populations with lower HIV-1 burden in sSA. We searched PubMed and identified and reviewed 64 studies on HIV-1 transmission dynamics within and between risk groups and geographic locations in sSA (published 1995-2021). We describe HIV-1 transmission from both a geographic and a risk group perspective in sSA. Finally, we discuss the challenges facing phylogenetic inference in mixed epidemics in sSA and offer our perspectives and potential solutions to the identified challenges.
Keywords: HIV-1; Sub-Saharan Africa; mixed epidemics; phylogenetics; transmission dynamics.
Conflict of interest statement
The authors declare no conflict of interest.
Figures

Similar articles
-
Mapping HIV clustering: a strategy for identifying populations at high risk of HIV infection in sub-Saharan Africa.Int J Health Geogr. 2013 May 22;12:28. doi: 10.1186/1476-072X-12-28. Int J Health Geogr. 2013. PMID: 23692994 Free PMC article.
-
Phylogenetic Tools for Generalized HIV-1 Epidemics: Findings from the PANGEA-HIV Methods Comparison.Mol Biol Evol. 2017 Jan;34(1):185-203. doi: 10.1093/molbev/msw217. Epub 2016 Oct 7. Mol Biol Evol. 2017. PMID: 28053012 Free PMC article.
-
Phylogenetic studies of transmission dynamics in generalized HIV epidemics: an essential tool where the burden is greatest?J Acquir Immune Defic Syndr. 2014 Oct 1;67(2):181-95. doi: 10.1097/QAI.0000000000000271. J Acquir Immune Defic Syndr. 2014. PMID: 24977473 Free PMC article. Review.
-
PANGEA-HIV 2: Phylogenetics And Networks for Generalised Epidemics in Africa.Curr Opin HIV AIDS. 2019 May;14(3):173-180. doi: 10.1097/COH.0000000000000542. Curr Opin HIV AIDS. 2019. PMID: 30946141 Free PMC article. Review.
-
Rewriting the narrative of the epidemiology of HIV in sub-Saharan Africa.SAHARA J. 2012;9(3):127-30. doi: 10.1080/17290376.2012.743787. SAHARA J. 2012. PMID: 23237066
Cited by
-
Spatial analysis and associated risk factors of HIV prevalence in Botswana: insights from the 2021 Botswana AIDS Impact Survey (BAIS V).BMC Infect Dis. 2025 Jan 16;25(1):69. doi: 10.1186/s12879-025-10464-x. BMC Infect Dis. 2025. PMID: 39815215 Free PMC article.
-
Comparison of HIV prevalence, incidence, and viral load suppression in Zambia population-based HIV impact assessments from 2016 and 2021.AIDS. 2024 May 1;38(6):895-905. doi: 10.1097/QAD.0000000000003834. Epub 2024 Jan 15. AIDS. 2024. PMID: 38227572 Free PMC article.
-
Temporal trends and transmission dynamics of pre-treatment HIV-1 drug resistance within and between risk groups in Kenya, 1986-2020.J Antimicrob Chemother. 2024 Feb 1;79(2):287-296. doi: 10.1093/jac/dkad375. J Antimicrob Chemother. 2024. PMID: 38091580 Free PMC article.
-
Quantifying rates of HIV-1 flow between risk groups and geographic locations in Kenya: A country-wide phylogenetic study.Virus Evol. 2022 Mar 3;8(1):veac016. doi: 10.1093/ve/veac016. eCollection 2022. Virus Evol. 2022. PMID: 35356640 Free PMC article.
-
The Role of Phylogenetics in Unravelling Patterns of HIV Transmission towards Epidemic Control: The Quebec Experience (2002-2020).Viruses. 2021 Aug 19;13(8):1643. doi: 10.3390/v13081643. Viruses. 2021. PMID: 34452506 Free PMC article.
References
-
- Field N., Cohen T., Struelens M.J., Palm D., Cookson B., Glynn J.R., Gallo V., Ramsay M., Sonnenberg P., MacCannell D. Strengthening the Reporting of Molecular Epidemiology for Infectious Diseases (STROME-ID): An extension of the STROBE statement. Lancet Infect. Dis. 2014;14:341–352. doi: 10.1016/S1473-3099(13)70324-4. - DOI - PubMed
-
- Riley L.W. Molecular Epidemiology of Infectious Diseases: Principles and Practices. American Society for Microbiology; Washington, DC, USA: 2004.
Publication types
MeSH terms
Grants and funding
LinkOut - more resources
Full Text Sources
Medical
Research Materials
