. 2021 Jun 21;13(6):1184.
doi: 10.3390/v13061184.

Age and Infectious Dose Significantly Affect Disease Progression after RHDV2 Infection in Naïve Domestic Rabbits

Affiliations

Age and Infectious Dose Significantly Affect Disease Progression after RHDV2 Infection in Naïve Domestic Rabbits

Robyn N Hall et al. Viruses. .

Abstract

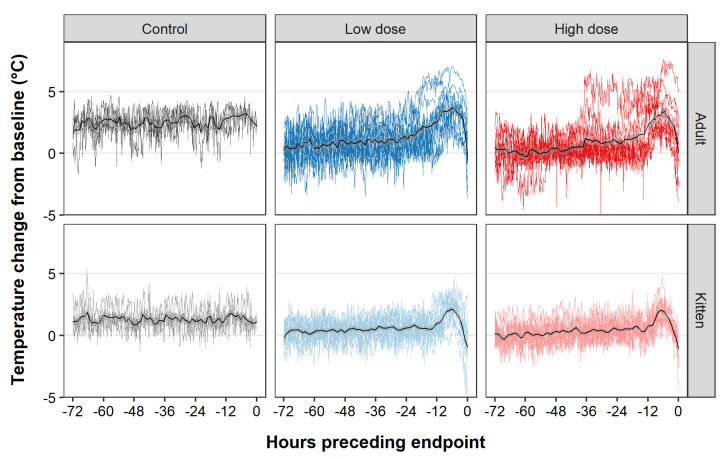
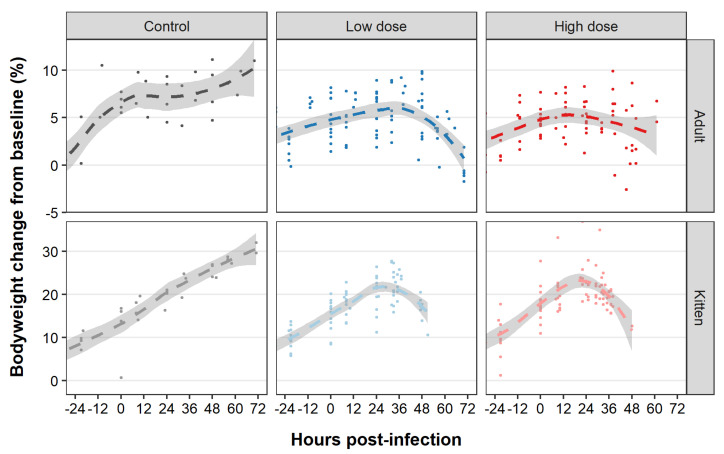
Rabbit haemorrhagic disease virus 2 (RHDV2 or GI.2, referring to any virus with lagovirus GI.2 structural genes) is a recently emerged calicivirus that causes generalised hepatic necrosis and disseminated intravascular coagulation leading to death in susceptible lagomorphs (rabbits and hares). Previous studies investigating the virulence of RHDV2 have reported conflicting results, with case fatality rates ranging from 0% to 100% even within a single study. Lagoviruses are of particular importance in Australia and New Zealand where they are used as biocontrol agents to manage wild rabbit populations, which threaten over 300 native species and result in economic impacts in excess of $200 million AUD annually to Australian agricultural industries. It is critically important that any pest control method is both highly effective (i.e., virulent, in the context of viral biocontrols) and has minimal animal welfare impacts. To determine whether RHDV2 might be a suitable candidate biocontrol agent, we investigated the virulence and disease progression of a naturally occurring Australian recombinant RHDV2 in both 5-week-old and 11-week-old New Zealand White laboratory rabbits after either high or low dose oral infection. Objective measures of disease progression were recorded through continuous body temperature monitoring collars, continuous activity monitors, and twice daily observations. We observed a 100% case fatality rate in both infected kittens and adult rabbits after either high dose or low dose infection. Clinical signs of disease, such as pyrexia, weight loss, and reduced activity, were evident in the late stages of infection. Clinical disease, i.e., welfare impacts, were limited to the period after the onset of pyrexia, lasting on average 12 h and increasing in severity as disease progressed. These findings confirm the high virulence of this RHDV2 variant in naïve rabbits. While age and infectious dose significantly affected disease progression, the case fatality rate was consistently 100% under all conditions tested.

Keywords: RHDV2; animal welfare; calicivirus; lagovirus; rabbit; rabbit haemorrhagic disease virus; virulence.


Conflict of interest statement

Funding for this work was provided through the Centre for Invasive Species Solutions to investigate RHDV2 as a potential additional biocontrol agent to manage invasive wild rabbits in Australia. The funding body and project lead did not have input into the experimental design, data analysis, or preparation of this manuscript.

Figures

Figure 1
Figure 1
Continuous temperature and activity monitoring. A cat collar was fitted for each rabbit, which comprised a SubCue-Mini temperature datalogger within a fabric pouch and a 3D accelerometer to measure activity levels. (A) Side view; (B) Skin-apposing view; (C) External-facing view; (D) Collar fitted on rabbit.
Figure 2
Figure 2
Survival and pyrexia following RHDV2 challenge. Adult (11-week-old) rabbits and kittens (5-week-old) were challenged with either a high virus dose (1000 RID50; n = 12 per age) or a low virus dose (50 RID50; n = 12 per age), or monitored as uninfected controls (n = 4 per age). The precise survival time after virus challenge was derived from continuous video camera monitoring. (A) Survival analysis was performed using survminer. Transparent shaded areas represent 95% confidence intervals. Plots are right-censored at 120 h post-infection; all control animals survived until the end of the experiment (i.e., 10 days post-infection). (B) Survival time was derived by combining data from time to euthanasia (humane endpoint) and time to death obtained from continuous camera monitoring. (C) Time to onset of pyrexia after RHDV2 challenge was estimated based on plots from continuous temperature monitoring collars. (D) The duration of clinical disease was taken to be the time between the onset of pyrexia and endpoint. Violin plots were constructed for each treatment group. Individual data points are shown as black dots. The mean for each treatment group is shown as a white diamond and the value of the mean (in hours) is given below each plot. Note that temperature collars did not record properly for two animals in the ‘adult, high dose’ group so n = 10 for this group in panels C and D. Significance was calculated using a two-sided Wilcoxon signed rank test in ggpubr. ns not significant, * p ≤ 0.05, ** p ≤ 0.01, *** p ≤ 0.001, **** p ≤ 0.0001.
Figure 2
Figure 2
Survival and pyrexia following RHDV2 challenge. Adult (11-week-old) rabbits and kittens (5-week-old) were challenged with either a high virus dose (1000 RID50; n = 12 per age) or a low virus dose (50 RID50; n = 12 per age), or monitored as uninfected controls (n = 4 per age). The precise survival time after virus challenge was derived from continuous video camera monitoring. (A) Survival analysis was performed using survminer. Transparent shaded areas represent 95% confidence intervals. Plots are right-censored at 120 h post-infection; all control animals survived until the end of the experiment (i.e., 10 days post-infection). (B) Survival time was derived by combining data from time to euthanasia (humane endpoint) and time to death obtained from continuous camera monitoring. (C) Time to onset of pyrexia after RHDV2 challenge was estimated based on plots from continuous temperature monitoring collars. (D) The duration of clinical disease was taken to be the time between the onset of pyrexia and endpoint. Violin plots were constructed for each treatment group. Individual data points are shown as black dots. The mean for each treatment group is shown as a white diamond and the value of the mean (in hours) is given below each plot. Note that temperature collars did not record properly for two animals in the ‘adult, high dose’ group so n = 10 for this group in panels C and D. Significance was calculated using a two-sided Wilcoxon signed rank test in ggpubr. ns not significant, * p ≤ 0.05, ** p ≤ 0.01, *** p ≤ 0.001, **** p ≤ 0.0001.
Figure 3
Figure 3
Temperature changes preceding death following RHDV2 infection. For each animal, the baseline temperature was calculated by averaging the temperature monitoring collar readings over a 1-h period prior to infection. This baseline was then subtracted from each reading to give the temperature change from baseline, and this was plotted against the time preceding endpoint. Data were excluded where technical errors were encountered with the collars (see Supplementary Figures). Time pre endpoint was used instead of hours post infection because the decline from the peak of pyrexia was very consistent between animals. Plots are faceted by age and treatment group. Overlaid coloured lines represent temperature profiles from individual animals. The solid black lines represent the smoothed conditional mean for each treatment group. This was calculated using local polynomial regression fitting as implemented in ggplot2 (geom_smooth (method = “loess”) with span = 0.05). Transparent grey shaded areas represent 95% confidence intervals.
Figure 4
Figure 4
Bodyweight changes following RHDV2 infection. Bodyweight was recorded at least daily until endpoint, commencing 24 h prior to virus challenge. Plots are right-censored at 72 h post-infection (i.e., after all infected animals reached humane endpoints or died). The change in bodyweight from baseline (in percent) at each measurement point and for each animal is shown as an individual dot. Plots are faceted by age and treatment group. The dashed lines represent the smoothed conditional mean for each treatment group. This was calculated using local polynomial regression fitting as implemented in ggplot2 (geom_smooth (method = “loess”) with default span). Transparent shaded areas represent 95% confidence intervals. Note that the y-axis scales differ for the two age groups.
Figure 5
Figure 5
Blood glucose concentration in kittens pre- and post-RHDV2 infection. Blood glucose concentration was measured in a subset of kittens using an ‘Accu-chek Performa’ glucometer before infection and at post-mortem. Data were restricted to those animals that were euthanised (n = 13 kittens). Paired box plots were generated for each timepoint. Individual data points are shown as black dots, and paired samples are linked by grey lines. Significance was tested using paired, two-sided Wilcoxon signed rank tests as implemented in ggpubr, and exact p-values are given.
Figure 6
Figure 6
Kinetics of viraemia after RHDV2 challenge. Blood samples were collected at 0- and 24-h post-infection and up to twice daily thereafter. Total RNA was extracted from whole blood and log10 virus capsid gene copies per mg blood were quantified by RT-qPCR. Individual measurements are shown as dots. Plots are faceted by age and treatment group. The dashed lines represent the smoothed conditional mean for each treatment group using local polynomial regression fitting as implemented in ggplot2 (geom_smooth (method = “loess”) with default span). Transparent shaded areas represent 95% confidence intervals. Plots are right-censored at 72 h post-infection for control animals.
Figure 7
Figure 7
Virus loads in the liver and blood after RHDV2 infection. Total RNA was extracted from whole blood and liver post-mortem samples and log10 virus capsid gene copies per mg blood were quantified by SYBR-based RT-qPCR. Significance was tested using paired, two-sided Wilcoxon signed rank tests as implemented in ggpubr, and the p-value is given. (A) Paired box plots were generated to compare post-mortem virus loads in the liver and whole blood. Individual data points are shown as black dots, and paired samples are linked by grey lines. (B) Virus loads in the liver were plotted as violin plots and compared between adult rabbits and kittens. Individual data points are shown as black dots. The mean virus load in the liver for each group is shown as a white diamond, and the value of the mean is given below each plot.
Figure 8
Figure 8
RHDV2-specific IgM reactivity after RHDV2 challenge. RHDV2-specific IgM reactivity was determined in pre-challenge and post-mortem sera by isotype-specific ELISA. Reactivity was calculated as the optical density of the sample at 1/40 dilution divided by the optical density of the negative control serum at 1/40 dilution. (A) Paired box plots were generated pre- and post- challenge. Individual data points are shown as black dots, and paired samples are linked by grey lines. Significance was tested using paired, two-sided Wilcoxon signed rank tests as implemented in ggpubr, and exact p-values are given. (B) The post-mortem RHDV2-specific IgM reactivity of infected rabbits was plotted against survival time. A simple linear regression model was plotted in grey.

References

    1. Abrantes J., van der Loo W., Le Pendu J., Esteves P.J. Rabbit haemorrhagic disease (RHD) and rabbit haemorrhagic disease virus (RHDV): A review. Vet. Res. 2012;43:12. doi: 10.1186/1297-9716-43-12. - DOI - PMC - PubMed
    1. Liu S.J., Xue H.P., Pu B.Q., Qian N.H. A new viral disease in rabbits. J. Vet. Diagn. Invest. 1984;16:253–255.
    1. Spickler A. Rabbit Hemorrhagic Disease. [(accessed on 5 March 2021)];2016 Available online: https://www.cfsph.iastate.edu/Factsheets/pdfs/rabbit_hemorrhagic_disease....
    1. Dalton K.P., Nicieza I., Balseiro A., Muguerza M.A., Rosell J.M., Casais R., Alvarez A.L., Parra F. Variant rabbit hemorrhagic disease virus in young rabbits, Spain. Emerg. Infect. Dis. 2012;18:2009–2012. doi: 10.3201/eid1812.120341. - DOI - PMC - PubMed
    1. Le Gall-Recule G., Zwingelstein F., Boucher S., Le Normand B., Plassiart G., Portejoie Y., Decors A., Bertagnoli S., Guerin J.L., Marchandeau S. Detection of a new variant of rabbit haemorrhagic disease virus in France. Vet. Rec. 2011;168:137–138. doi: 10.1136/vr.d697. - DOI - PubMed

Publication types

LinkOut - more resources