. 2021 Jun 21;10(6):991.
doi: 10.3390/antiox10060991.

Clinical Performance of Paraoxonase-1-Related Variables and Novel Markers of Inflammation in Coronavirus Disease-19. A Machine Learning Approach

Affiliations

Clinical Performance of Paraoxonase-1-Related Variables and Novel Markers of Inflammation in Coronavirus Disease-19. A Machine Learning Approach

Elisabet Rodríguez-Tomàs et al. Antioxidants (Basel). .

Abstract

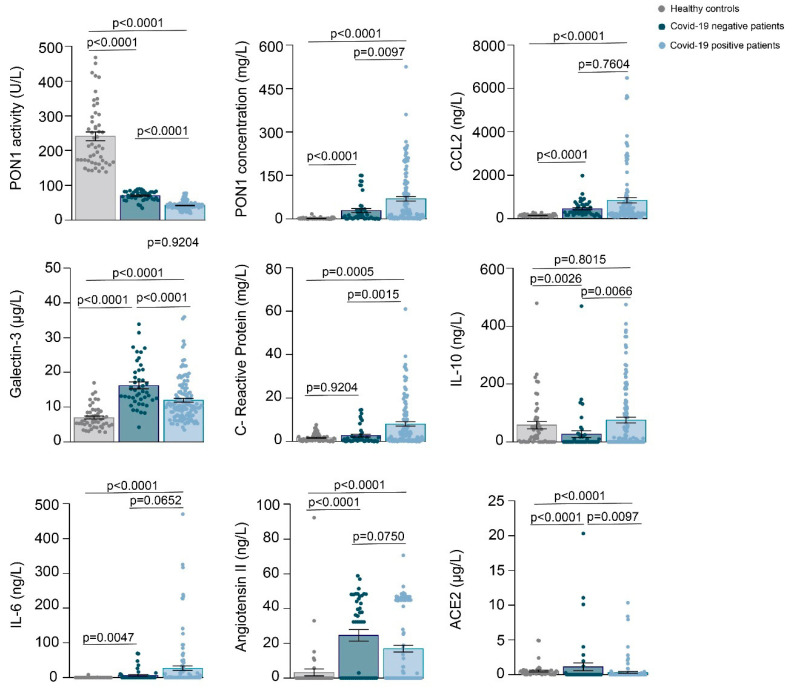
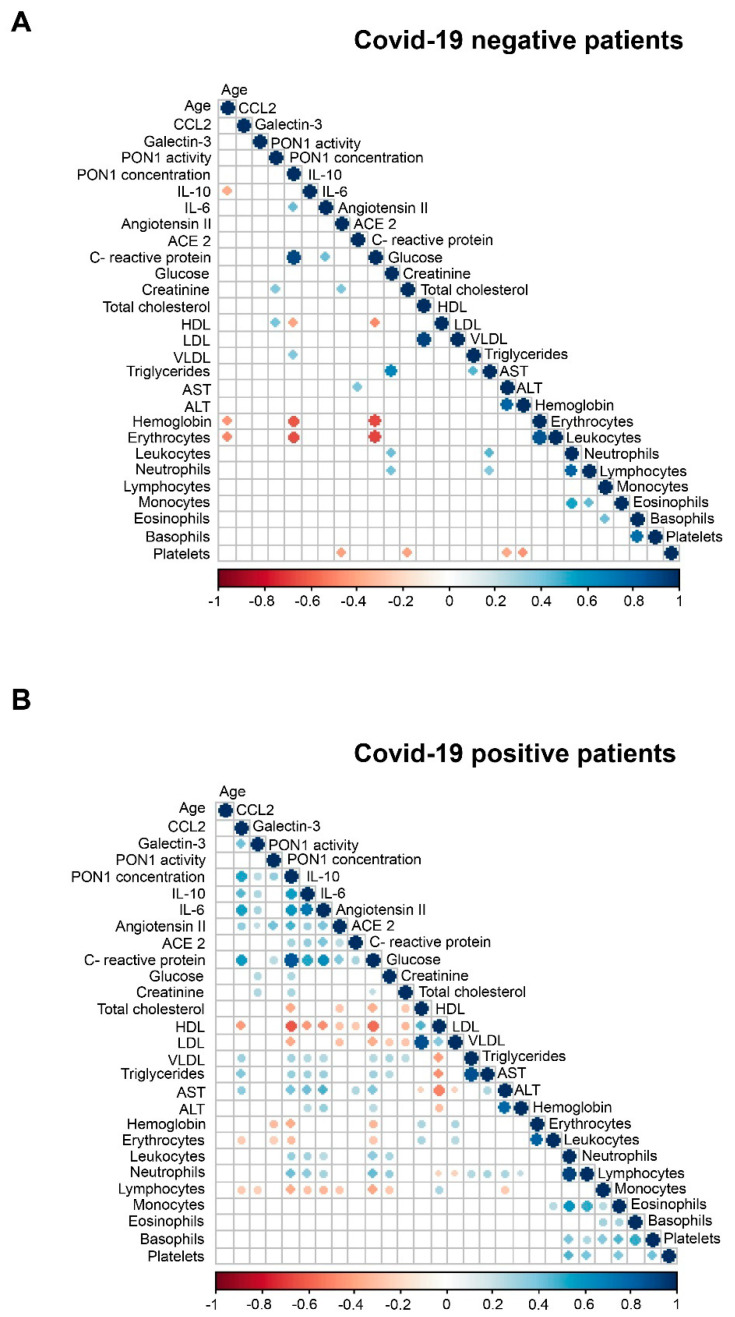
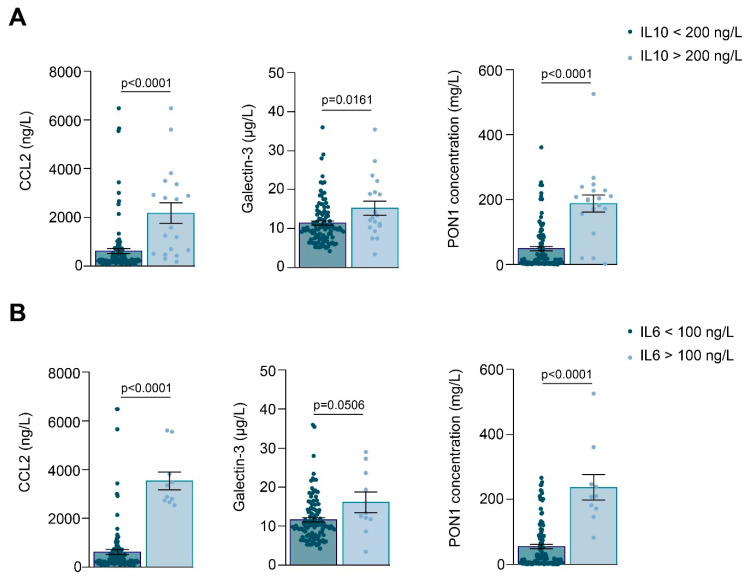
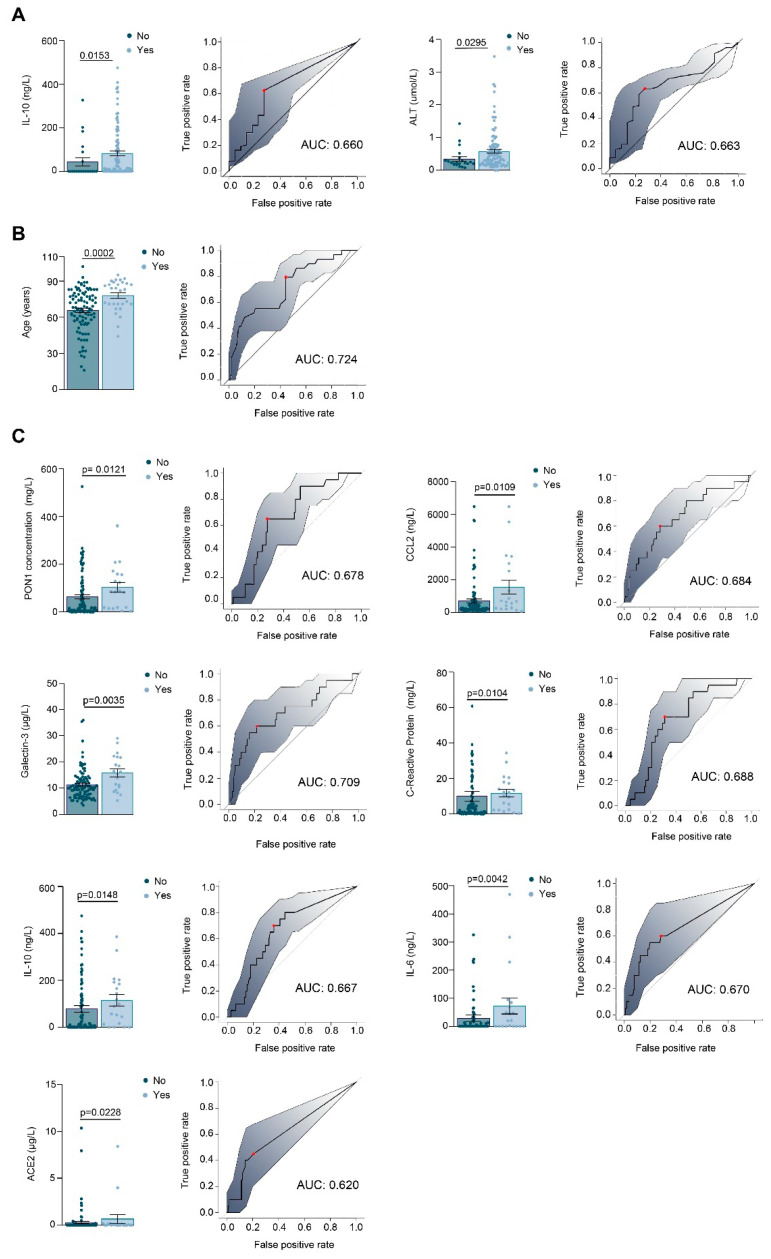
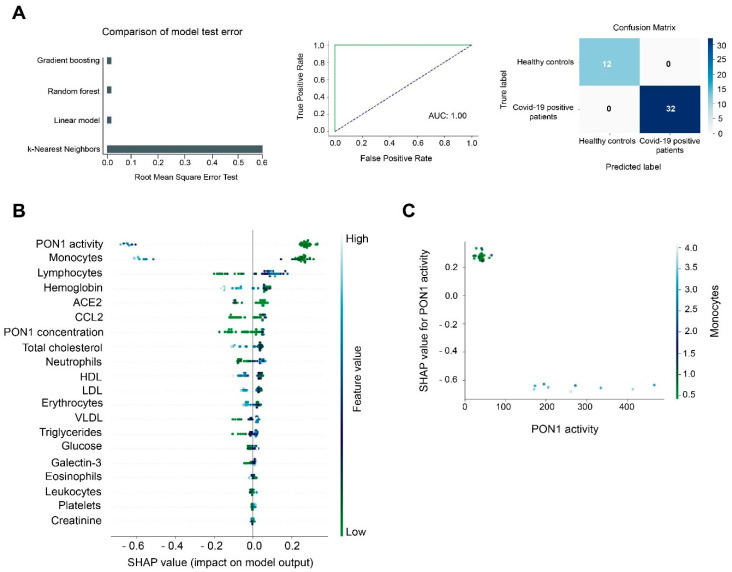
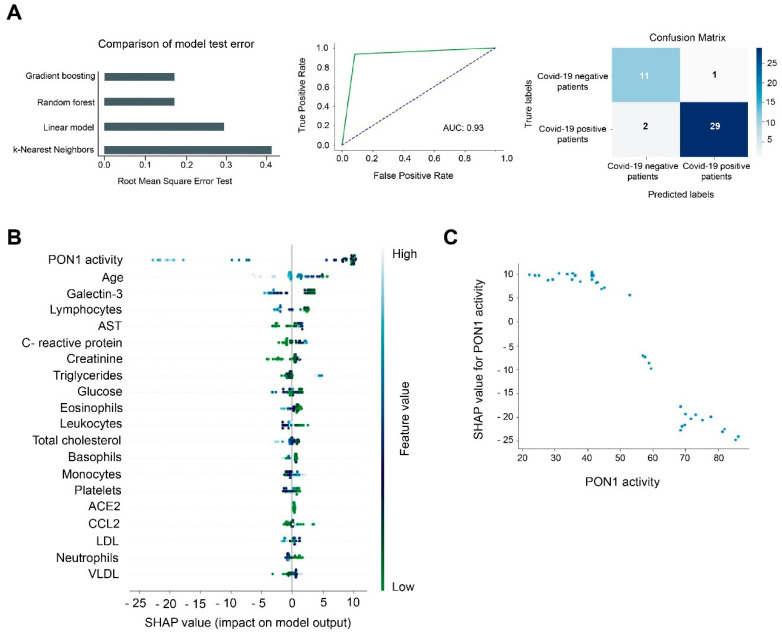
SARS-CoV-2 infection produces a response of the innate immune system causing oxidative stress and a strong inflammatory reaction termed 'cytokine storm' that is one of the leading causes of death. Paraoxonase-1 (PON1) protects against oxidative stress by hydrolyzing lipoperoxides. Alterations in PON1 activity have been associated with pro-inflammatory mediators such as the chemokine (C-C motif) ligand 2 (CCL2), and the glycoprotein galectin-3. We aimed to investigate the alterations in the circulating levels of PON1, CCL2, and galectin-3 in 126 patients with COVID-19 and their interactions with clinical variables and analytical parameters. A machine learning approach was used to identify predictive markers of the disease. For comparisons, we recruited 45 COVID-19 negative patients and 50 healthy individuals. Our approach identified a synergy between oxidative stress, inflammation, and fibrogenesis in positive patients that is not observed in negative patients. PON1 activity was the parameter with the greatest power to discriminate between patients who were either positive or negative for COVID-19, while their levels of CCL2 and galectin-3 were similar. We suggest that the measurement of serum PON1 activity may be a useful marker for the diagnosis of COVID-19.

Keywords: COVID-19; SARS-CoV-2; biomarkers; chemokines; galectin-3; machine learning; paraoxonase-1.


Conflict of interest statement

The authors declare no conflict of interest. The funder had no role in the study design, data collection, analysis, decision to publish, or manuscript preparation.

Figures

Figure 1
Figure 1
Scatter plots with error bars of selected variables in healthy controls, patients COVID-19 negative and COVID-19 positive. Results are given as means and standard error of the mean (SEM). Statistical analyses were performed using the Mann-Whitney U test.
Figure 2
Figure 2
Spearman correlation matrices of analytical variables in COVID-19 negative (A) and COVID-19 positive (B) patients. The magnitude and direction of the correlations are shown by circle size (larger is stronger) and with colors (positive correlation: blue; negative correlation: red), respectively.
Figure 3
Figure 3
Interleukin (IL)-10 (A) and IL-6 (B) concentrations are associated with CCL2, galectin-3, and PON1 concentrations in COVID-19 positive patients. The figure shows scatter plots with error bars of selected variables segregated according to IL-10 and IL-6 concentrations. Results are given as means and standard error of the mean (SEM). Statistical analyses were performed using the Mann-Whitney U test.
Figure 4
Figure 4
Relationships between selected variables and the clinical characteristics of COVID-19 positive patients. The figure shows scatter plots with error bars and Receiver Operating Characteristics curves of the variables that presented with significant differences in relation to whether patients were admitted to Intensive Care Unit (A), died during their hospital stay (B), or received invasive mechanical ventilation (C). Results are given as means and standard error of the mean (SEM). Statistical analyses were performed using the Mann-Whitney U test.
Figure 5
Figure 5
Gradient Boosting Machine (GBM) as a diagnostic model of prediction of COVID-19. PON1 activity and monocyte concentrations discriminate between COVID-19 positive patients and the healthy population. (A) Root mean squared error test of the GBM, Random Forest, Lineal Model, and K-Nearest Neighbors. The Receiver Operating Characteristic curve and matrix confusion of the GBM model shows an area under the curve (AUC) of 1.00. (B) A SHapley Additive exPlanations (SHAP) summary plot of the GBM shows the top 20 features predicting COVID-19. Positive SHAP values indicate the presence of COVID-19 in patients, while negative values indicate the absence of disease. The colors indicate high (light blue) or low (light green) levels of each of the variables. SHAP values on the x-axis indicate the distribution of the prediction among the features. (C) The relationship between PON1 activity and monocyte concentration is shown by the Partial Dependence plot.
Figure 6
Figure 6
Gradient Boosting Machine (GBM) as a diagnostic model of prediction of COVID-19. PON1 activity discriminates between COVID-19 positive and negative patients. (A) Root mean squared error test of the GBM, Random Forest, Lineal Model, and K-Nearest Neighbors. The Receiver Operating Characteristic curve and matrix confusion of the GBM model shows an area under the curve (AUC) of 0.93. (B) SHapley Additive exPlanations (SHAP) summary plot of the GBM showing the top 20 features predicting COVID-19. Positive SHAP values indicate the presence of COVID-19 in patients, while negative values indicate the absence of disease. The colors indicate high (light blue) or low (light green) levels of each of the variables. SHAP values on the x-axis indicate the distribution of the prediction among the features. (C) Partial Dependence plot of PON1 activity.

Similar articles

Cited by

References

    1. Eisenreich W., Rudel T., Heesemann J., Goebel W. How viral and intracellular bacterial pathogens reprogram the metabolism of host cells to allow their intracellular replication. Front. Cell. Infect. Microbiol. 2019;9:42. doi: 10.3389/fcimb.2019.00042. - DOI - PMC - PubMed
    1. Netea M.G., Joosten L.A., Latz E., Mills K.H., Natoli G., Stunnenberg H.G., O’Neill L.A., Xavier R.J. Trained immunity: A program of innate immune memory in health and disease. Science. 2016;352:aaf1098. doi: 10.1126/science.aaf1098. - DOI - PMC - PubMed
    1. Lartigue L., Faustin B. Mitochondria: Metabolic regulators of innate immune responses to pathogens and cell stress. Int. J. Biochem. Cell. Biol. 2013;45:2052–2056. doi: 10.1016/j.biocel.2013.06.014. - DOI - PubMed
    1. Monlun M., Hyernard C., Blanco P., Lartigue L., Faustin B. Mitochondria as molecular platforms integrating multiple innate immune signalings. J. Mol. Biol. 2017;429:1–13. doi: 10.1016/j.jmb.2016.10.028. - DOI - PubMed
    1. Jin H.S., Suh H.W., Kim S.J., Jo E.K. Mitochondrial control of innate immunity and inflammation. Immune Netw. 2017;17:77–88. doi: 10.4110/in.2017.17.2.77. - DOI - PMC - PubMed

LinkOut - more resources