

Insight into Codon Utilization Pattern of Tumor Suppressor Gene EPB41L3 from Different Mammalian Species Indicates Dominant Role of Selection Force
- PMID: 34205890
- PMCID: PMC8198080
- DOI: 10.3390/cancers13112739
Insight into Codon Utilization Pattern of Tumor Suppressor Gene EPB41L3 from Different Mammalian Species Indicates Dominant Role of Selection Force
Abstract
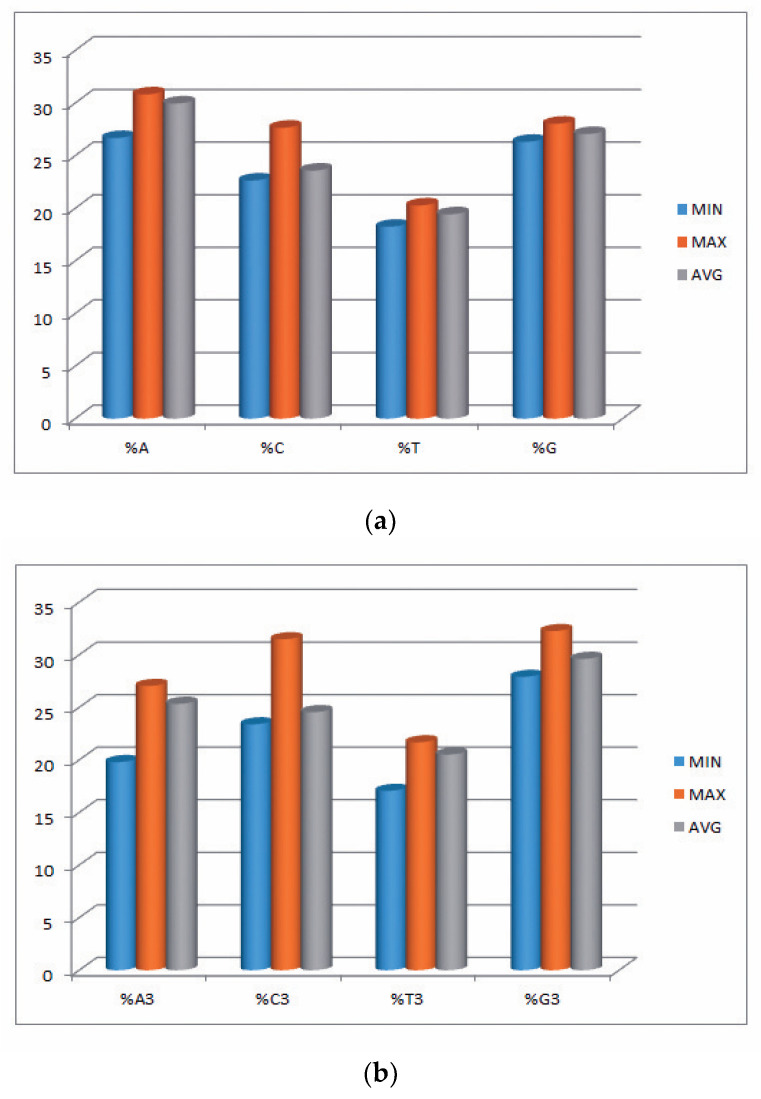
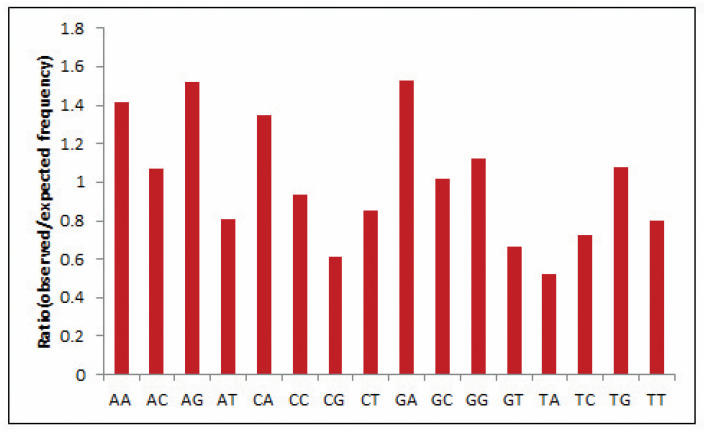
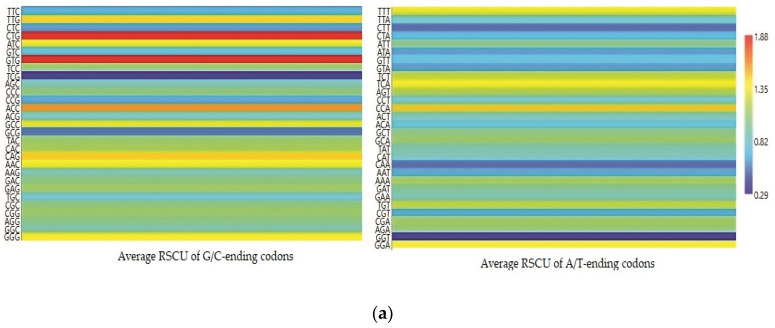
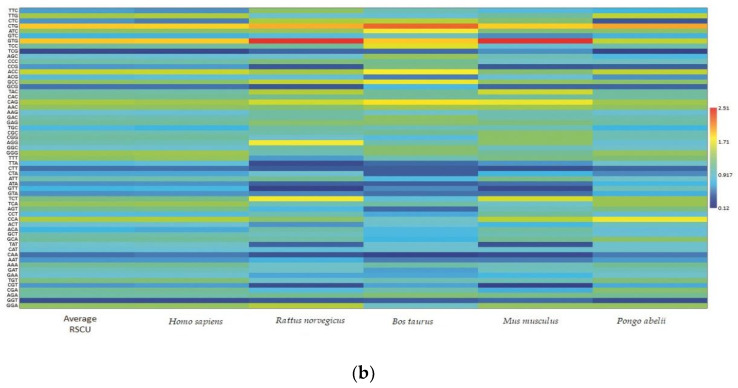
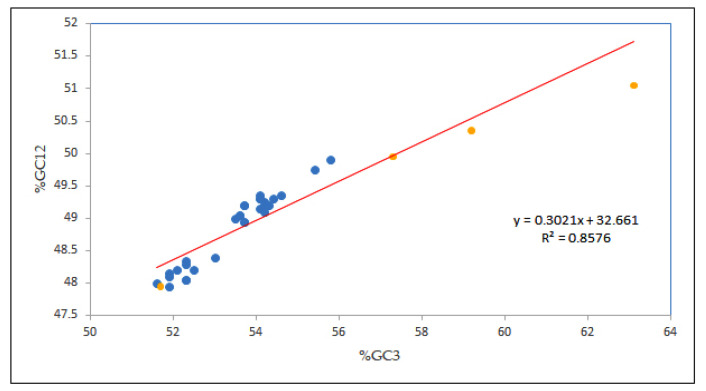
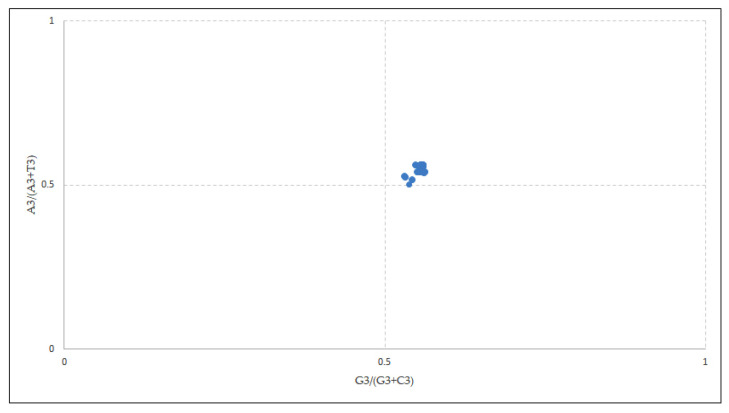
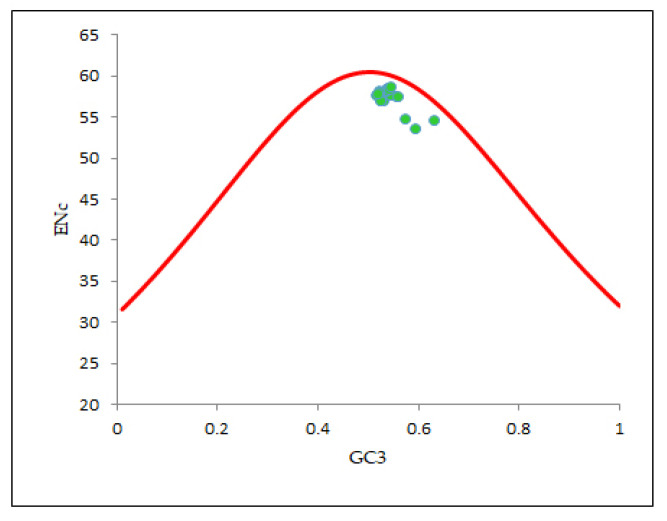
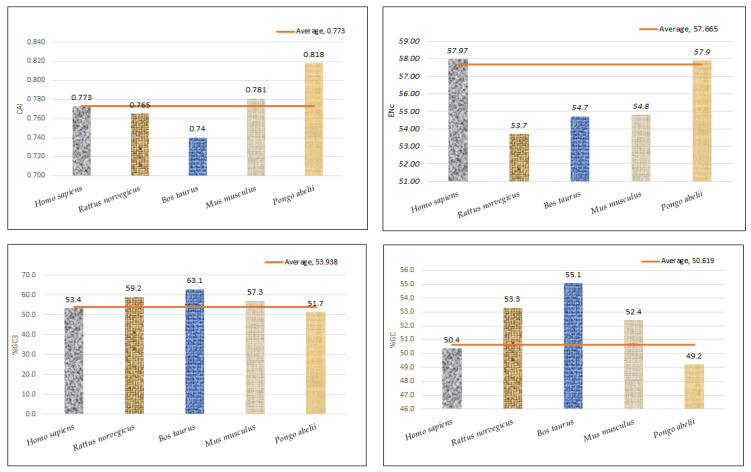
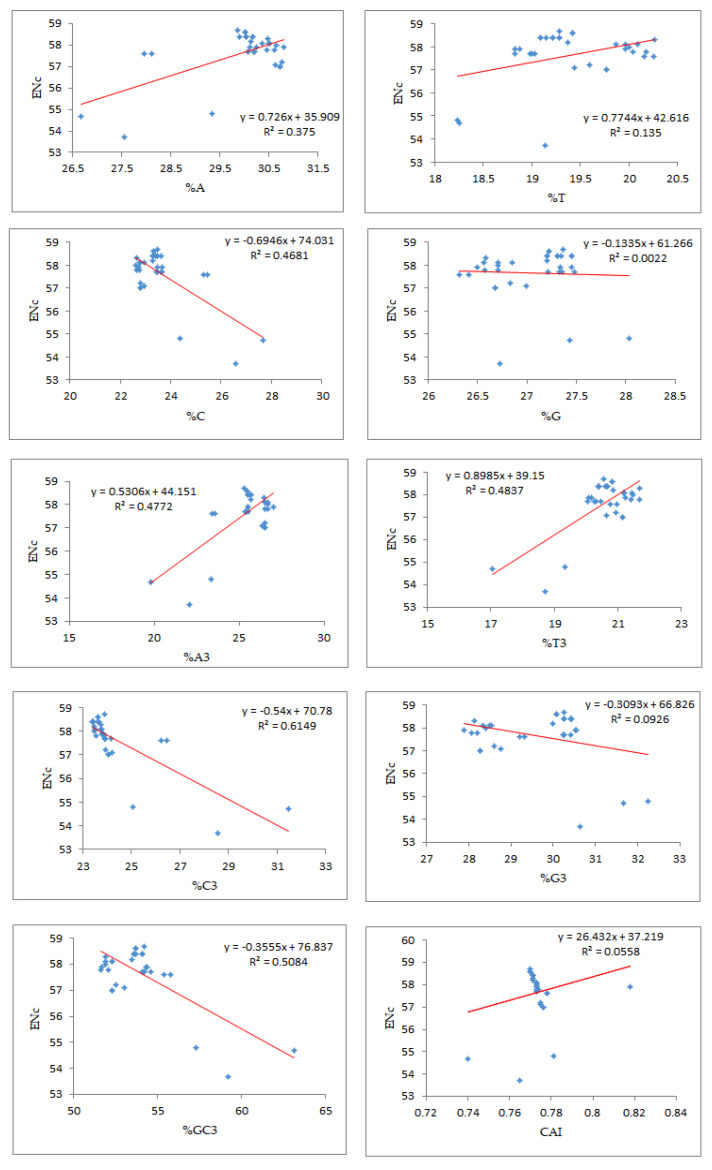
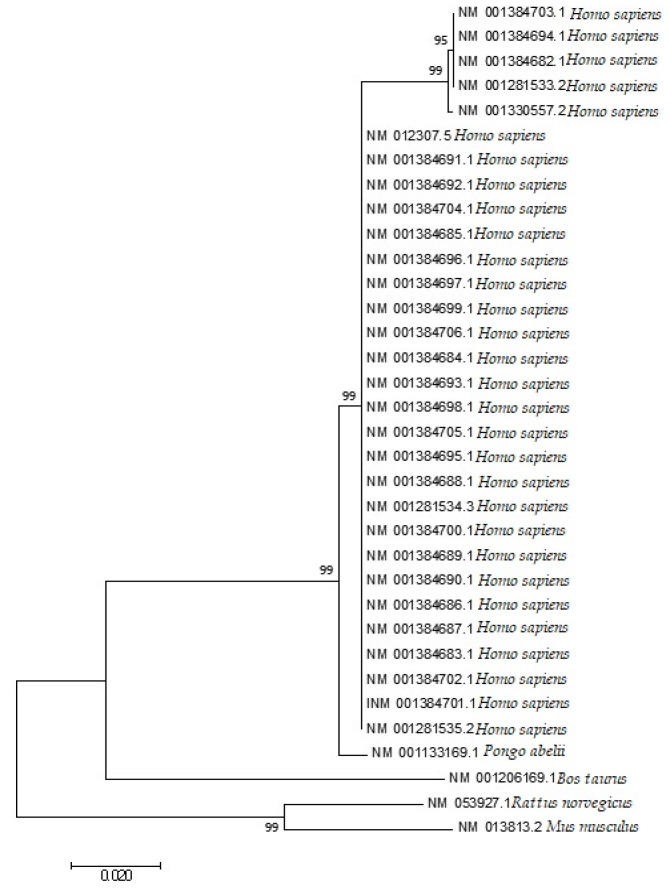
Uneven codon usage within genes as well as among genomes is a usual phenomenon across organisms. It plays a significant role in the translational efficiency and evolution of a particular gene. EPB41L3 is a tumor suppressor protein-coding gene, and in the present study, the pattern of codon usage was envisaged. The full-length sequences of the EPB41L3 gene for the human, brown rat, domesticated cattle, and Sumatran orangutan available at the NCBI were retrieved and utilized to analyze CUB patterns across the selected mammalian species. Compositional properties, dinucleotide abundance, and parity analysis showed the dominance of A and G whilst RSCU analysis indicated the dominance of G/C-ending codons. The neutrality plot plotted between GC12 and GC3 to determine the variation between the mutation pressure and natural selection indicated the dominance of selection pressure (R = 0.926; p < 0.00001) over the three codon positions across the gene. The result is in concordance with the codon adaptation index analysis and the ENc-GC3 plot analysis, as well as the translational selection index (P2). Overall selection pressure is the dominant pressure acting during the evolution of the EPB41L3 gene.
Keywords: EPB41L3; GC contents; RSCU; codon usage bias; mutational pressure; natural selection; translational efficiency.
Conflict of interest statement
The authors declare no conflict of interest.
Figures
Similar articles
-
Preference of A/T ending codons in mitochondrial ATP6 gene under phylum Platyhelminthes: Codon usage of ATP6 gene in Platyhelminthes.Mol Biochem Parasitol. 2018 Oct;225:15-26. doi: 10.1016/j.molbiopara.2018.08.007. Epub 2018 Aug 24. Mol Biochem Parasitol. 2018. PMID: 30149040
-
Factors affecting the codon usage bias of SRY gene across mammals.Gene. 2017 Sep 30;630:13-20. doi: 10.1016/j.gene.2017.08.003. Epub 2017 Aug 4. Gene. 2017. PMID: 28827114
-
Comparative genome analysis of six malarial parasites using codon usage bias based tools.Bioinformation. 2012;8(24):1230-9. doi: 10.6026/97320630081230. Epub 2012 Dec 8. Bioinformation. 2012. PMID: 23275725 Free PMC article.
-
Codon usage pattern in human SPANX genes.Bioinformation. 2015 Oct 31;11(10):454-9. doi: 10.6026/97320630011454. eCollection 2015. Bioinformation. 2015. PMID: 26664029 Free PMC article.
-
Codon Usage Pattern of Genes Involved in Central Nervous System.Mol Neurobiol. 2019 Mar;56(3):1737-1748. doi: 10.1007/s12035-018-1173-y. Epub 2018 Jun 19. Mol Neurobiol. 2019. PMID: 29922982
Cited by
-
Hormonal Therapy for Gynecological Cancers: How Far Has Science Progressed toward Clinical Applications?Cancers (Basel). 2022 Feb 1;14(3):759. doi: 10.3390/cancers14030759. Cancers (Basel). 2022. PMID: 35159024 Free PMC article. Review.
-
Dynamic evolution of peste des petits ruminants virus in sheep and goat hosts across India reveals the swift surge of F gene.Virusdisease. 2024 Sep;35(3):505-519. doi: 10.1007/s13337-024-00890-x. Epub 2024 Sep 11. Virusdisease. 2024. PMID: 39464739
-
Comparative analysis of codon usage patterns of Plasmodium helical interspersed subtelomeric (PHIST) proteins.Front Microbiol. 2023 Dec 14;14:1320060. doi: 10.3389/fmicb.2023.1320060. eCollection 2023. Front Microbiol. 2023. PMID: 38156001 Free PMC article.
-
Codon Usage is Influenced by Compositional Constraints in Genes Associated with Dementia.Front Genet. 2022 Aug 9;13:884348. doi: 10.3389/fgene.2022.884348. eCollection 2022. Front Genet. 2022. PMID: 36017501 Free PMC article.
-
Analysis of codon usage bias of thioredoxin in apicomplexan protozoa.Parasit Vectors. 2023 Nov 21;16(1):431. doi: 10.1186/s13071-023-06002-w. Parasit Vectors. 2023. PMID: 37990340 Free PMC article.
References
-
- Yamada D., Kikuchi S., Williams Y.N., Sakurai-Yageta M., Masuda M., Maruyama T., Tomita K., Gutmann D.H., Kakizoe T., Kitamura T., et al. Promoter hypermethylation of the potential tumor suppressor DAL-1/4.1B gene in renal clear cell carcinoma. Int. J. Cancer. 2006;118:916–923. doi: 10.1002/ijc.21450. - DOI - PubMed
-
- Zeng R., Liu Y., Jiang Z.J., Huang J.P., Wang Y., Li X.F., Xiong W.B., Wu X.C., Zhang J.R., Wang Q.E., et al. EPB41L3 is a potential tumor suppressor gene and prognostic indicator in esophageal squamous cell carcinoma. Int. J. Oncol. 2018;52:1443–1454. doi: 10.3892/ijo.2018.4316. - DOI - PMC - PubMed
LinkOut - more resources
Full Text Sources
Miscellaneous
