

Cancellation of Auxetic Properties in F.C.C. Hard Sphere Crystals by Hybrid Layer-Channel Nanoinclusions Filled by Hard Spheres of Another Diameter
- PMID: 34206145
- PMCID: PMC8199564
- DOI: 10.3390/ma14113008
Cancellation of Auxetic Properties in F.C.C. Hard Sphere Crystals by Hybrid Layer-Channel Nanoinclusions Filled by Hard Spheres of Another Diameter
Abstract
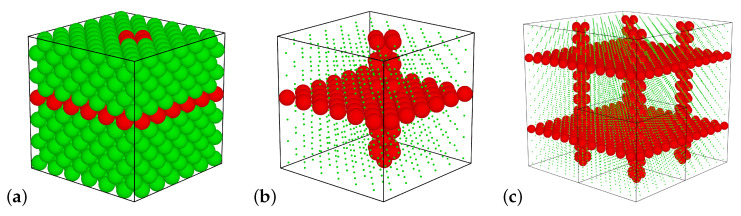
The elastic properties of f.c.c. hard sphere crystals with periodic arrays of nanoinclusions filled by hard spheres of another diameter are the subject of this paper. It has been shown that a simple modification of the model structure is sufficient to cause very significant changes in its elastic properties. The use of inclusions in the form of joined (mutually orthogonal) layers and channels showed that the resulting tetragonal system exhibited a complete lack of auxetic properties when the inclusion spheres reached sufficiently large diameter. Moreover, it was very surprising that this hybrid inclusion, which can completely eliminate auxeticity, was composed of components that, alone, in these conditions, enhanced the auxeticity either slightly (layer) or strongly (channel). The study was performed with computer simulations using the Monte Carlo method in the isothermal-isobaric (NpT) ensemble with a variable box shape.
Keywords: Monte Carlo simulations; auxetics; hard spheres; inclusions; nanochannels; nanolayers; negative Poisson’s ratio.
Conflict of interest statement
The authors declare no conflict of interest. The funders had no role in the design of the study; in the collection, analyses, or interpretation of data; in the writing of the manuscript; nor in the decision to publish the results.
Figures


Similar articles
-
Removing Auxetic Properties in f.c.c. Hard Sphere Crystals by Orthogonal Nanochannels with Hard Spheres of Another Diameter.Materials (Basel). 2022 Feb 1;15(3):1134. doi: 10.3390/ma15031134. Materials (Basel). 2022. PMID: 35161078 Free PMC article.
-
Auxeticity Tuning by Nanolayer Inclusion Ordering in Hard Sphere Crystals.Materials (Basel). 2024 Sep 17;17(18):4564. doi: 10.3390/ma17184564. Materials (Basel). 2024. PMID: 39336304 Free PMC article.
-
Poisson's Ratio of the f.c.c. Hard Sphere Crystals with Periodically Stacked (001)-Nanolayers of Hard Spheres of Another Diameter.Materials (Basel). 2019 Feb 27;12(5):700. doi: 10.3390/ma12050700. Materials (Basel). 2019. PMID: 30818797 Free PMC article.
-
Hardening of fcc hard-sphere crystals by introducing nanochannels: Auxetic aspects.Phys Rev E. 2023 Oct;108(4-2):045003. doi: 10.1103/PhysRevE.108.045003. Phys Rev E. 2023. PMID: 37978598
-
Two-dimensional materials with intrinsic auxeticity: progress and perspectives.Nanoscale. 2019 Jun 20;11(24):11413-11428. doi: 10.1039/c9nr03546j. Nanoscale. 2019. PMID: 31188370 Review.
Cited by
-
Removing Auxetic Properties in f.c.c. Hard Sphere Crystals by Orthogonal Nanochannels with Hard Spheres of Another Diameter.Materials (Basel). 2022 Feb 1;15(3):1134. doi: 10.3390/ma15031134. Materials (Basel). 2022. PMID: 35161078 Free PMC article.
-
Auxeticity Tuning by Nanolayer Inclusion Ordering in Hard Sphere Crystals.Materials (Basel). 2024 Sep 17;17(18):4564. doi: 10.3390/ma17184564. Materials (Basel). 2024. PMID: 39336304 Free PMC article.
References
-
- Evans K.E. Auxetic polymers: A new range of materials. Endeavour. 1991;15:170–174. doi: 10.1016/0160-9327(91)90123-S. - DOI
-
- Landau L.D., Lifshitz E.M. Theory of Elasticity. Pergamon Press; London, UK: 1986.
-
- Wojciechowski K.W. Constant thermodynamic tension Monte Carlo studies of elastic properties of a two-dimensional system of hard cyclic hexamers. Mol. Phys. 1987;61:1247–1258. doi: 10.1080/00268978700101761. - DOI
-
- Gibson L.J., Ashby M.F. Cellular Solids: Structure and Properties. Pergamon Press; Oxford, UK: 1988.
Grants and funding
LinkOut - more resources
Full Text Sources
