Review
. 2021 Jun 22;9(7):702.
doi: 10.3390/biomedicines9070702.

Biosensors Designed for Clinical Applications

Affiliations
Review

Biosensors Designed for Clinical Applications

James F Rusling et al. Biomedicines. .

Abstract

Emerging and validated biomarkers promise to revolutionize clinical practice, shifting the emphasis away from the management of chronic disease towards prevention, early diagnosis and early intervention. The challenge of detecting these low abundance protein and nucleic acid biomarkers within the clinical context demands the development of highly sensitive, even single molecule, assays that are also capable of selectively measuring a small number of defined analytes in complex samples such as whole blood, interstitial fluid, saliva or urine. Success relies on significant innovations in nanomaterials, bioreceptor engineering, transduction strategies and microfluidics. Primarily using examples from our work, this article discusses some recent advance in the selective and sensitive detection of disease biomarkers, highlights key innovations in sensor materials and identifies issues and challenges that need to be carefully considered especially for researchers entering the field.

Keywords: biomarkers; cancer; cardiovascular and neurological diseases; clinical analysis; electrochemical sensors; electrochemiluminescence; epilepsy; microfluidics; point of care.


Conflict of interest statement

The authors declare no conflict of interest.

Figures

Figure 1
Figure 1
Principles of ELISA-like sandwich assays for proteins utilizing a capture antibody (Ab1) on a surface and a single or multiple labeled detection antibody (Ab2). Detection of labels can employ several techniques, including optical and electrochemical methods.
Figure 2
Figure 2
Electrochemical immunoarray for protein detection showing (A) exploded view of microfluidic detection channel featuring molded polydimethylsiloxane (PDMS) channel enclosing and 8-sensor array and Ag/AgCl reference and Pt-wire counter electrodes running the full length of the channel, (B) full microfluidic system showing programmable syringe pumps, injector, and 8-sensor array, and (C) Kanichi 8-carbon sensor array coated with Au-nanoparticle layers and attached capture antibodies.
Figure 3
Figure 3
Oral cancer biomarker proteins detected in 1% calf serum in PBS by the amperometric microfluidic array after incubation of Ab2-MB-HRP-analytes in detection chamber, then injecting mixture of H2O2 and HQ: (A) duplicate reproducible peaks in simultaneous measurements of a mixture of 10 fg mL−1 IL-6, 15 fg mL−1 IL-8, 25 fg mL−1 VEGF, and 60 fg mL−1 VEGF-C, (B) VEGF peaks in mixtures of all biomarker proteins. (CF) Immunoarray calibrations of background corrected peak currents for IL-6 (C), IL-8 (D), VEGF (E), VEGF-C (F). Error bars are standard deviations for n = 6. Reprinted from [26]. Copyright 2012 American Chemical Society.
Figure 4
Figure 4
Receiver operating characteristic (ROC) curves for serum assays for (A) IL-6, AUC 0.86 (red line), IL-8 with AUC 0.83 (blue line), VEGF with AUC 0.95 (green line), VEGF-C with AUC 0.83 (brown line), and (B) mean normalized value for all four proteins, with AUC 0.96. Reprinted from [26]. Copyright 2012 American Chemical Society.
Figure 5
Figure 5
Box plots for patient samples. Protein biomarker levels in male patient serum (excluding outliers): (A,B) benign vs. cancer (high end outliers removed). (C,D) Indolent vs. aggressive (indolent—Gleason score of 6, aggressive—Gleason score >8). Error bars at 95% confidence. Reproduced from [34], copyright America Chemical society, 2021.
Figure 6
Figure 6
Calibration plots, ROC, and decision curves for predicting need for biopsy. Calibration plots illustrate predicted probabilities on the x-axis and the actual outcome on the y-axis (A1) PSA alone, (A2) selected biomarkers + PSA, model 2, and (A3) selected biomarkers, model 3. (B) ROC plot and AUC values of the biomarkers at each risk threshold, for the best model PSA + selected biomarkers. sensitivity and specificity are both 79%; (C) decision curves showing the net benefit of treating all patients or treating none vs. threshold probability. Reproduced from [34], copyright American Chemical society, 2021.
Figure 7
Figure 7
Microfluidic immunoarray for cell disruption and protein detection. The design features a microfluidic chip with five inlets connected to peristaltic micropumps, sample and rectangular prism reagent chambers with capacity of 80 ± 5 μL, and eight cylindrical detection chambers with 8 ± 1 μL capacity each. The microfluidic chip houses sample and reagents and delivers them sequentially to the detection compartment. The assay protocol utilizes poly-HRP and ultra-bright femto-luminol to produce chemiluminescence (CL) that is captured in a dark box using a CCD camera. The microfluidic chip is mounted on the housing device support equipped with a sonic cell disruptor that achieves cell lysis. Programmable micropumps are connected to microfluidic chip sample and reagent chambers and the assay is automated by using an Arduino microcontroller that control pump on/off cycles. Adapted from [43], with permission. Copyright Elsevier, 2021.
Figure 8
Figure 8
Recolorized CL CCD camera for 15 s integration for protein analytes in (A) standards and (B) cancer cell cultures. (DF) Calibrations of the microfluidic immunoarray for (C) DSG3, (D) VEGF-C, (E) VEGF-A, and (F) β-Tub (n = 8). Adapted from [43], with permission. Copyright Elsevier, 2021.
Figure 9
Figure 9
Protein concentrations found using online cell lysis of single cell or cell-free samples filtered and washed to remove cell culture media for cancer cell cultures (A) HN12, (B) HN13, (C) HN30, and (D) CAL27 (n = 6). Number of cells was estimated using the β-Tub concentration per single cell. Zero cell or single cell samples are marked on the graphs for DSG3 and VEGF-A. Adapted from [43], reprinted with permission. Copyright Elsevier, 2021.
Figure 10
Figure 10
(A) Rendered 3D image of the five-layer microfluidic disc platform comprising three 1.5-mm thick PMMA discs and two 90-μm thick pressure sensitive adhesive films. The gold electrodes were deposited on the bottom (layer 5) of the disc. (B) Fully assembled disc showing contact points for the working and counter electrodes. (C) Schematic of electrochemical cancer cell capture assay on polymeric eLoaD platform. Reproduced with permission from [76].
Figure 11
Figure 11
(A) Schematic representation of the nucleic acid sandwich assay using electrocatalytic nanoparticles as labels on the probe strand. (B) Calibration curve for difference in current (Δi) before and after injection of hydrogen peroxide against known concentration of miR-206 oligonucleotides (linear between 100 nM and 100 aM). Reproduced with permission from [79].
Figure 12
Figure 12
(A) Dependence of interfacial resistance (n = 3) on cTnI concentration where the primary antibodies are mAb20B3 (●) and mAb228 (■), following exposure to increasing cTnI target (1 ag/mL to 1 ng/mL) and after immobilization of the Ir (III)-labeled commercial secondary antibody mAb19C7 (B). In all cases, the supporting electrolyte is 1 mM DPBS and EIS was recorded between 0.01 and 100,000 Hz using an alternating current (ac) amplitude of 25 mV. Reproduced with permission from [83].
Figure 13
Figure 13
Confocal images of an electrode modified with 16-mercaptohexadecanoic acid and the in-house-generated mAb20B3 (A) and a commercially available Hytest mAb228 primary antibody (B), following exposure to the cTnI target (1 ag/mL to 1 ng/mL) and the Ir(III)-labeled commercial secondary antibody (mAb19C7). Luminescence images were recorded live on a Zeiss LSM510 Meta confocal microscope using a 40× oil immersion objective lens (NA 1.4) and a 488 nm argon ion laser applied for iridium-labeled antibody imaging. Scale bar 20 μm. Reproduced with permission from [83].
Figure 14
Figure 14
Schematic illustration of the fabrication of recombinant antibody-based biosensor for the detection of C-reactive protein. First, scFv fragments are immobilized on the electrode surface. Second, the pentameric CRP target binds. Third, scFv fragments that are labeled with a ruthenium polypyridine type metal complex are bound and used to generate ECL. Reproduced with permission from [90].
Figure 15
Figure 15
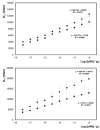
Dependence of the ECL emission intensity on the CRP concentration. From top to bottom at +1.2 V, the concentrations of CRP range from 600 ng mL−1 to 5 fg mL−1. Not all ECL responses are shown. The inset shows dependence of the logarithm of the maximum ECL intensity on log[CRP]. The error bars are comparable to, or smaller than, the size of the symbols. Reproduced with permission from [90].

References

    1. [(accessed on 19 March 2021)]; Available online: https://jamaicahospital.org/newsletter/history-of-thermometers/
    1. Wang J. Glucose Biosensors: 40 Years of Advances and Challenges. Electroanalysis. 2001;12:983–988. doi: 10.1002/1521-4109(200108)13:12<983::AID-ELAN983>3.0.CO;2-#. - DOI
    1. Henning T.P., Cunningham D.D. Biosensors for Personal Diabetes Management. In: Ramsey G., editor. Commercial Biosensors: Applications to Clinical, Bioprocess, and Environmental Samples. John Wiley & Sons; New York, NY, USA: 1998. pp. 3–46.
    1. Forster R.J., Cumba L.R. Bioelectronics and Medical Devices. Woodhead Publishing; Cambridge, UK: 2019. Optimizing Glucose Sensing for Diabetes Monitoring; pp. 765–778.
    1. Jones A., Dhanapala L., Kankanamage R.N.T., Kumar C.V., Rusling J.F. Multiplexed Immunosensors and Immunoarrays. Anal. Chem. 2020;92:345–362. doi: 10.1021/acs.analchem.9b05080. - DOI - PMC - PubMed

LinkOut - more resources