

Salivary DNA Methylation as an Epigenetic Biomarker for Head and Neck Cancer. Part II: A Cancer Risk Meta-Analysis
- PMID: 34206840
- PMCID: PMC8304899
- DOI: 10.3390/jpm11070606
Salivary DNA Methylation as an Epigenetic Biomarker for Head and Neck Cancer. Part II: A Cancer Risk Meta-Analysis
Abstract
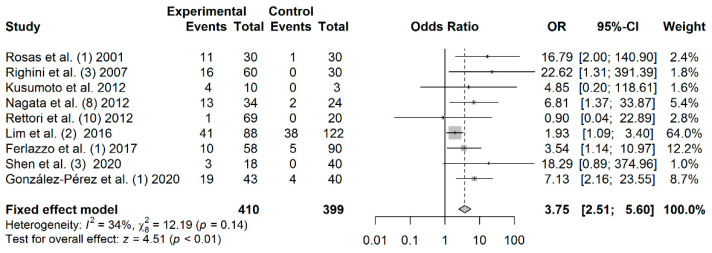
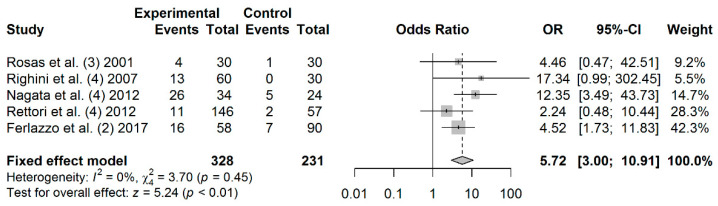
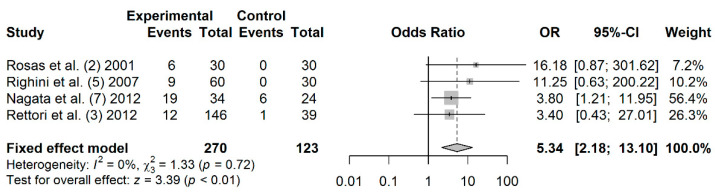
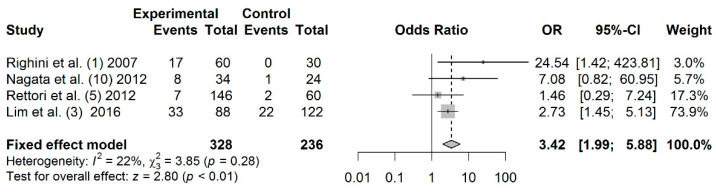
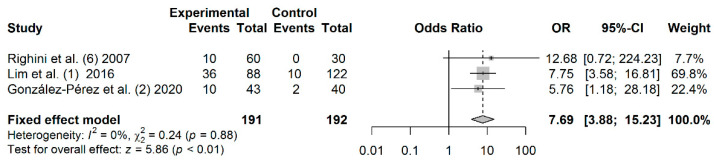
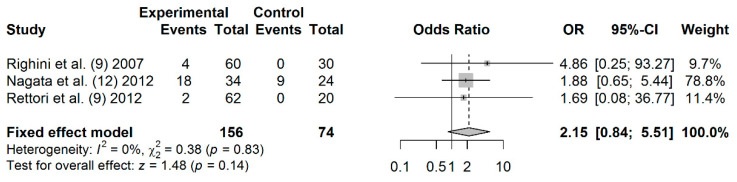
Aberrant methylation of tumor suppressor genes has been reported as an important epigenetic silencer in head and neck cancer (HNC) pathogenesis. Here, we performed a comprehensive meta-analysis to evaluate the overall and specific impact of salivary gene promoter methylation on HNC risk. The methodological quality was assessed using the Newcastle-Ottawa scale (NOS). Odds ratios (ORs) and 95% confidence intervals (CIs) were calculated to evaluate the strength of the association and Egger's and Begg's tests were applied to detect publication bias. The frequency of salivary DNA promoter methylation was significantly higher in HNC patients than in healthy controls (OR: 8.34 (95% CI = 6.10-11.39; p < 0.01). The pooled ORs showed a significant association between specific tumor-related genes and HNC risk: p16 (3.75; 95% CI = 2.51-5.60), MGMT (5.72; 95% CI = 3.00-10.91), DAPK (5.34; 95% CI = 2.18-13.10), TIMP3 (3.42; 95% CI = 1.99-5.88), and RASSF1A (7.69; 95% CI = 3.88-15.23). Overall, our meta-analysis provides precise evidence on the association between salivary DNA promoter hypermethylation and HNC risk. Thus, detection of promoter DNA methylation in saliva is a potential biomarker for predicting HNC risk.
Keywords: DNA methylation; biomarkers; epigenetics; head and neck cancer; liquid biopsy; meta-analysis; saliva.
Conflict of interest statement
R.L.-L. reports other from Nasasbiotech, during the conduct of the study; grants and personal fees from Roche, grants and personal fees from Merck, personal fees from AstraZeneca, personal fees from Bayer, personal fees and non-financial support from BMS, personal fees from Pharmamar, personal fees from Leo, outside the submitted work. The rest of the authors have nothing to disclose. The funders had no role in the design of the study; in the collection, analyses, or interpretation of data; in the writing of the manuscript, or in the decision to publish the results.
Figures

Similar articles
-
RASSF1A promoter methylation is associated with increased risk of thyroid cancer: a meta-analysis.Onco Targets Ther. 2017 Jan 9;10:247-257. doi: 10.2147/OTT.S124417. eCollection 2017. Onco Targets Ther. 2017. PMID: 28123306 Free PMC article.
-
Salivary DNA Methylation as an Epigenetic Biomarker for Head and Neck Cancer. Part I: A Diagnostic Accuracy Meta-Analysis.J Pers Med. 2021 Jun 17;11(6):568. doi: 10.3390/jpm11060568. J Pers Med. 2021. PMID: 34204396 Free PMC article. Review.
-
Meta-analysis of promoter methylation in eight tumor-suppressor genes and its association with the risk of thyroid cancer.PLoS One. 2017 Sep 19;12(9):e0184892. doi: 10.1371/journal.pone.0184892. eCollection 2017. PLoS One. 2017. PMID: 28926589 Free PMC article.
-
Promoter methylation as biomarkers for diagnosis of melanoma: A systematic review and meta-analysis.J Cell Physiol. 2019 May;234(5):7356-7367. doi: 10.1002/jcp.27495. Epub 2018 Oct 28. J Cell Physiol. 2019. PMID: 30370527
-
Systemic Immun e-Inflammation Index as a Predictor for Head and Neck Cancer Prognosis: A Meta-Analysis.Front Oncol. 2022 Jun 24;12:899518. doi: 10.3389/fonc.2022.899518. eCollection 2022. Front Oncol. 2022. PMID: 35814369 Free PMC article.
Cited by
-
Prenatal Environmental Stressors and DNA Methylation Levels in Placenta and Peripheral Tissues of Mothers and Neonates Evaluated by Applying Artificial Neural Networks.Genes (Basel). 2023 Mar 30;14(4):836. doi: 10.3390/genes14040836. Genes (Basel). 2023. PMID: 37107594 Free PMC article.
-
Special Issue "Cancer Biomarker Research and Personalized Medicine".J Pers Med. 2022 Apr 5;12(4):585. doi: 10.3390/jpm12040585. J Pers Med. 2022. PMID: 35455701 Free PMC article.
-
The repertoire of mutational signatures in tobacco- and non-tobacco-induced oral cancer.Clin Transl Oncol. 2023 Dec;25(12):3332-3344. doi: 10.1007/s12094-023-03192-8. Epub 2023 Apr 14. Clin Transl Oncol. 2023. PMID: 37058208 Review.
References
-
- Hulbert A., Jusue-Torres I., Stark A., Chen C., Rodgers K., Lee B., Griffin C., Yang A., Huang P., Wrangle J., et al. Early detection of lung cancer using DNA promoter hypermethylation in plasma and sputum. Clin. Cancer Res. 2017;23:1998–2005. doi: 10.1158/1078-0432.CCR-16-1371. - DOI - PMC - PubMed
-
- Patai Á.V., Valcz G., Hollósi P., Kalmár A., Peterfia B., Wichmann B., Spisák S., Barták B.K., Leiszter K., Tóth K., et al. Comprehensive DNA methylation analysis reveals a common ten-gene methylation signature in colorectal adenomas and carcinomas. PLoS ONE. 2015;10:e0133836. doi: 10.1371/journal.pone.0133836. - DOI - PMC - PubMed
Publication types
LinkOut - more resources
Full Text Sources
Research Materials
