

The Impact of Elongation on Change in Electrical Resistance of Electrically Conductive Yarns Woven into Fabric
- PMID: 34207430
- PMCID: PMC8235346
- DOI: 10.3390/ma14123390
The Impact of Elongation on Change in Electrical Resistance of Electrically Conductive Yarns Woven into Fabric
Abstract
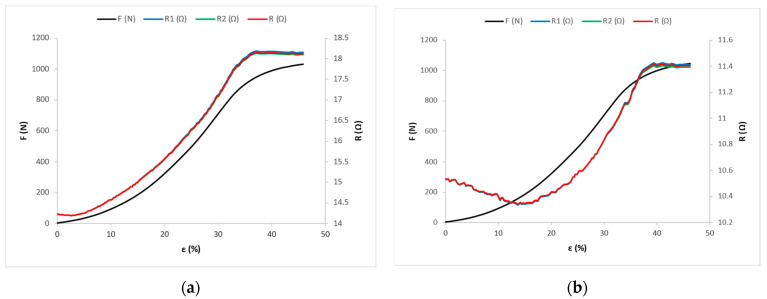
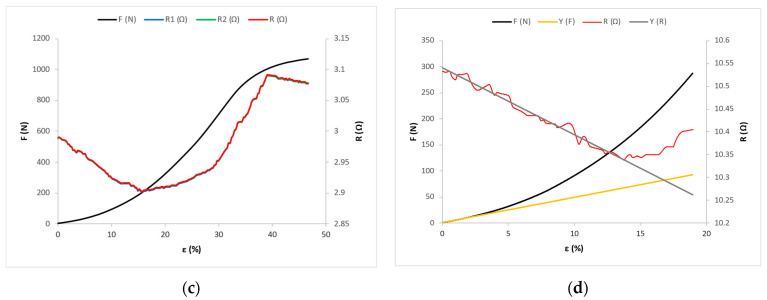
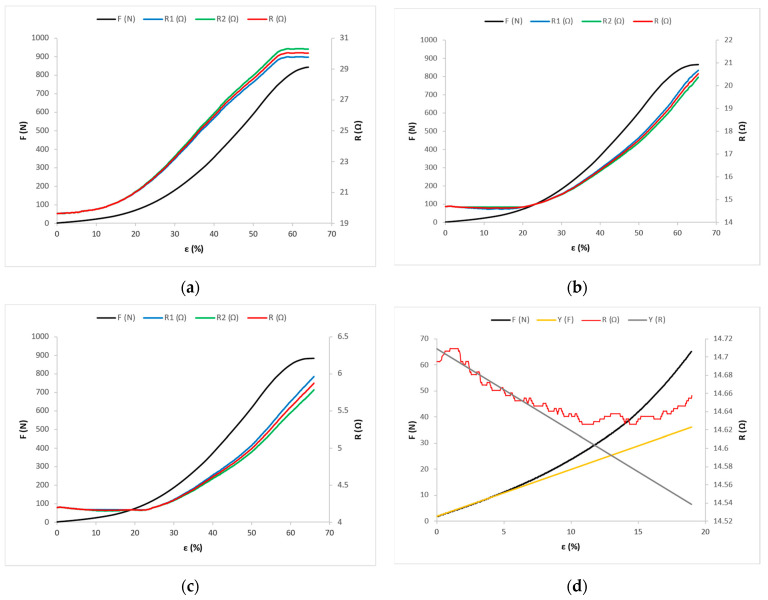
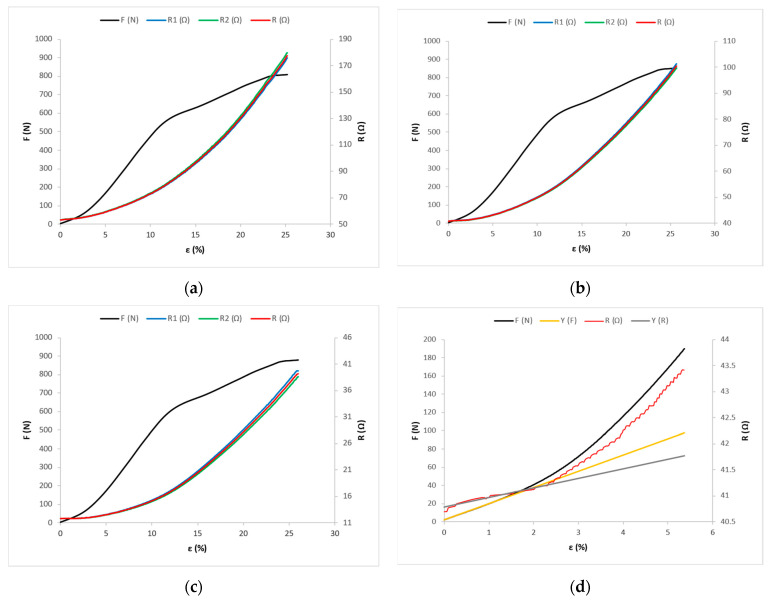
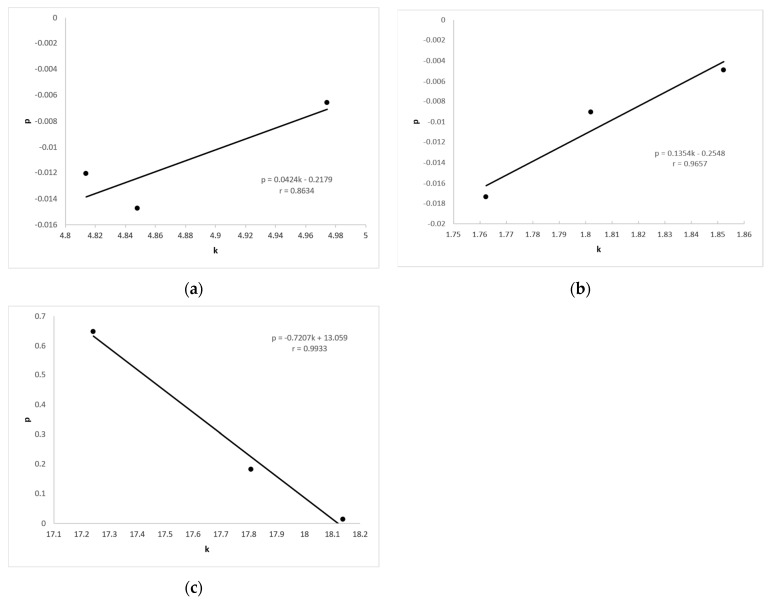
Electrically conductive yarns (ECYs) are gaining increasing applications in woven textile materials, especially in woven sensors suitable for incorporation into clothing. In this paper, the effect of the yarn count of ECYs woven into fabric on values of electrical resistance is analyzed. We also observe how the direction of action of elongation force, considering the position of the woven ECY, effects the change in the electrical resistance of the electrically conductive fabric. The measurements were performed on nine different samples of fabric in a plain weave, into which were woven ECYs with three different yarn counts and three different directions. Relationship curves between values of elongation forces and elongation to break, as well as relationship curves between values of electrical resistance of fabrics with ECYs and elongation, were experimentally obtained. An analytical mathematical model was also established, and analysis was conducted, which determined the models of function of connection between force and elongation, and between electrical resistance and elongation. The connection between the measurement results and the mathematical model was confirmed. The connection between the mathematical model and the experimental results enables the design of ECY properties in woven materials, especially textile force and elongation sensors.
Keywords: electrically conductive yarn; elongation; plain weave; resistance; tensile force; woven fabric.
Conflict of interest statement
The authors declare no conflict of interest.
Figures
References
-
- Tao X.S. Smart Fibres, Fabrics and Clothing. Woodhead Publishing Limited; Cambridge, UK: CRC Press LLC; Cambridge, UK: 2001. pp. 1–6, 35–57, 124–149, 247–253.
-
- Mattila H. Yarn to Fabric: Intelligent Textiles. In: Sinclair R., editor. Textiles and Fashion—Materials, Design and Technology. Woodhead Publishing Limited; Cambridge, UK: CRC Press LLC; Cambridge, UK: 2014. - DOI
-
- Gao Q., Jinjie Z., Zhenwen X., Olatunji O., Jinyong Z., Lei W., Hui L. Highly stretchable sensors for wearable biomedical applications. J. Mater. Sci. 2019;54:7. doi: 10.1007/s10853-018-3171-x. - DOI
Grants and funding
LinkOut - more resources
Full Text Sources
Other Literature Sources
