. 2021 Jun 9;22(12):6227.
doi: 10.3390/ijms22126227.

Different Roles of p62 (SQSTM1) Isoforms in Keratin-Related Protein Aggregation

Affiliations

Different Roles of p62 (SQSTM1) Isoforms in Keratin-Related Protein Aggregation

Meghana Somlapura et al. Int J Mol Sci. .

Abstract

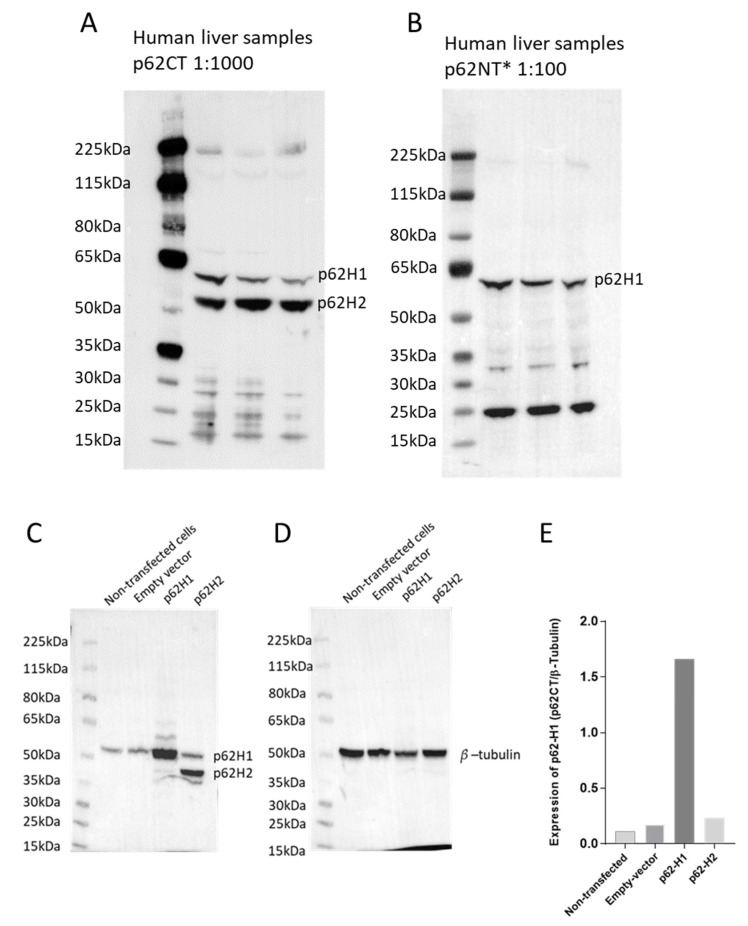
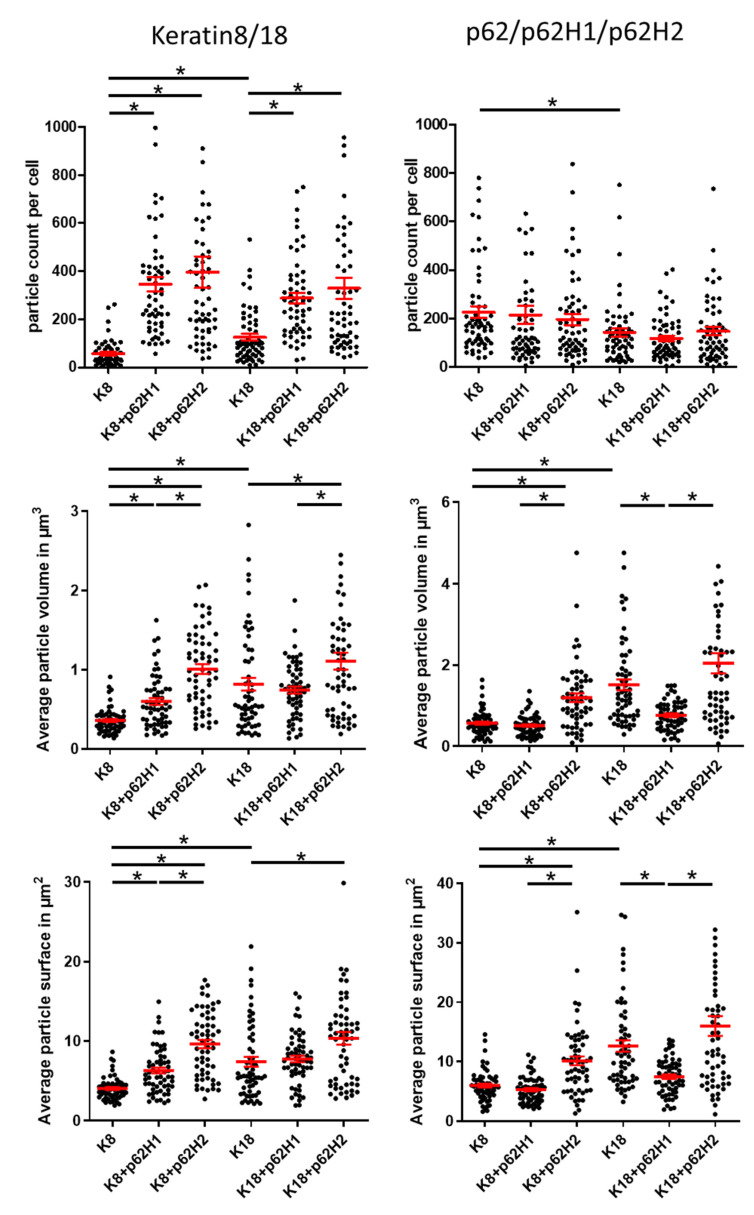
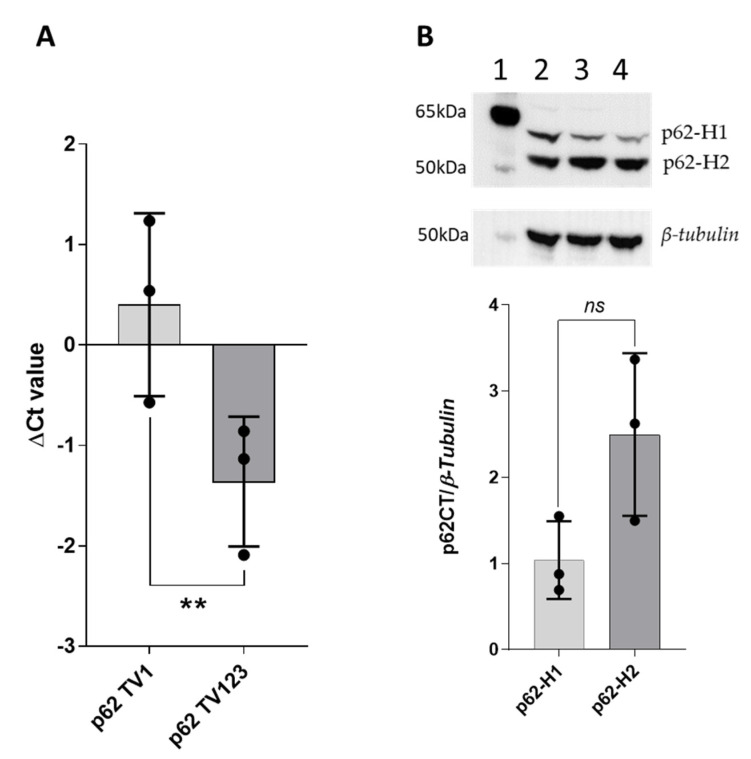
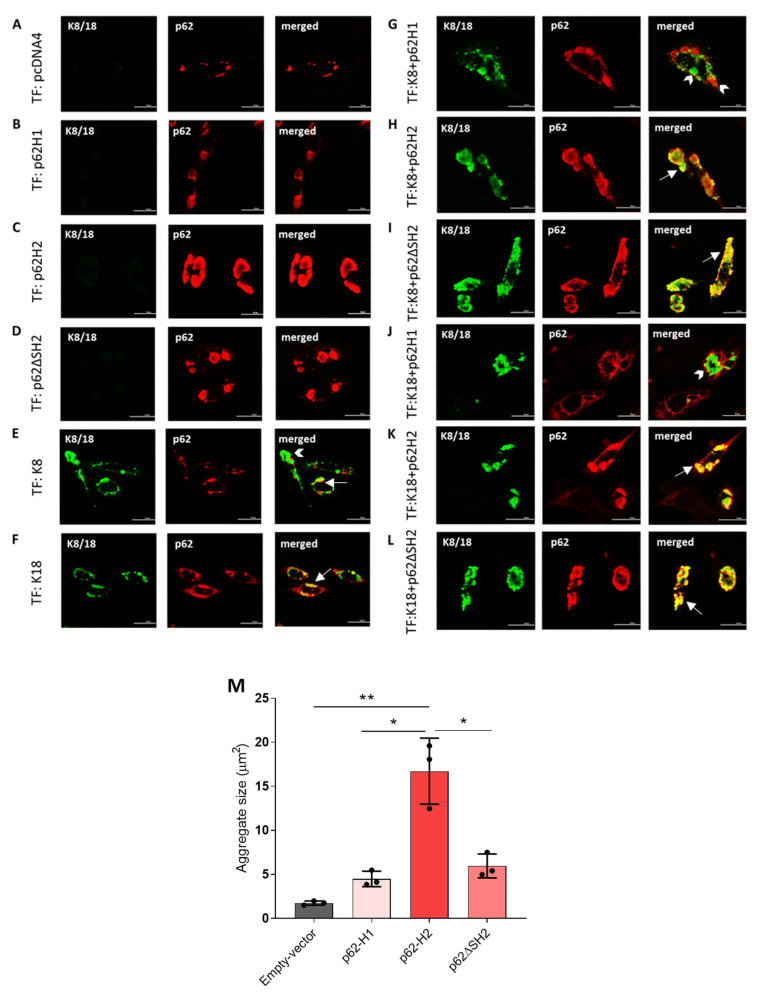
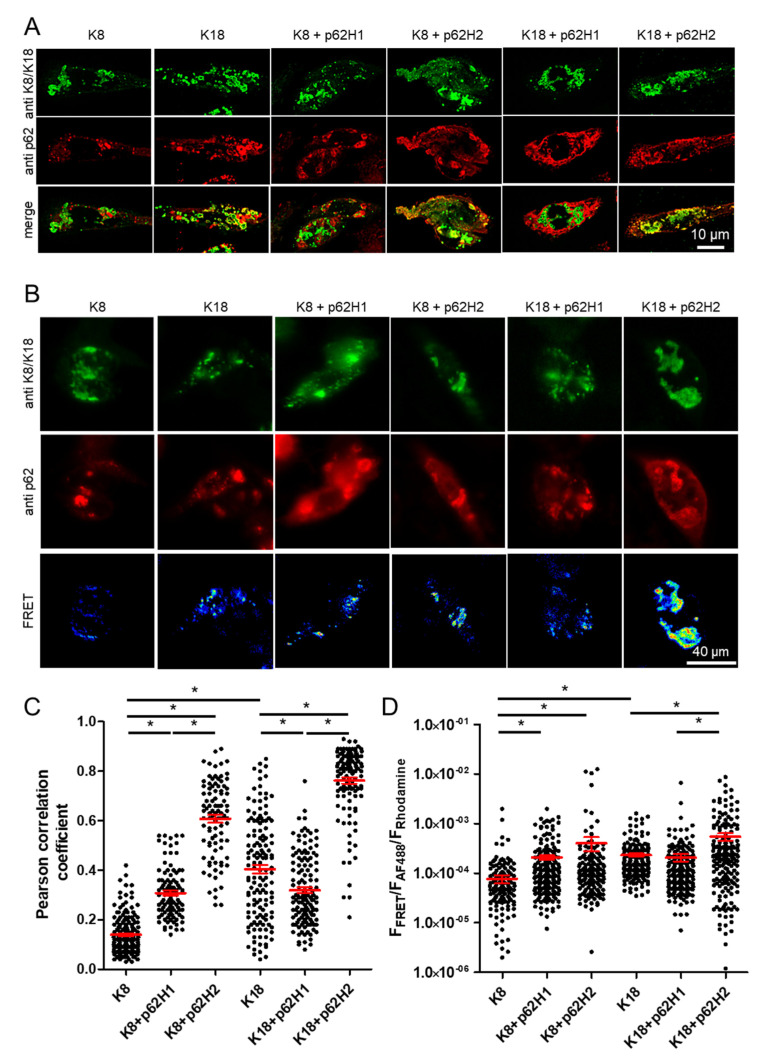
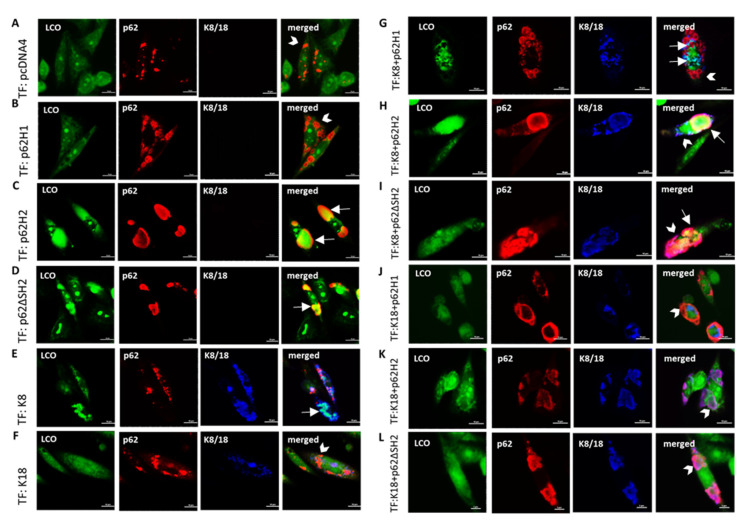
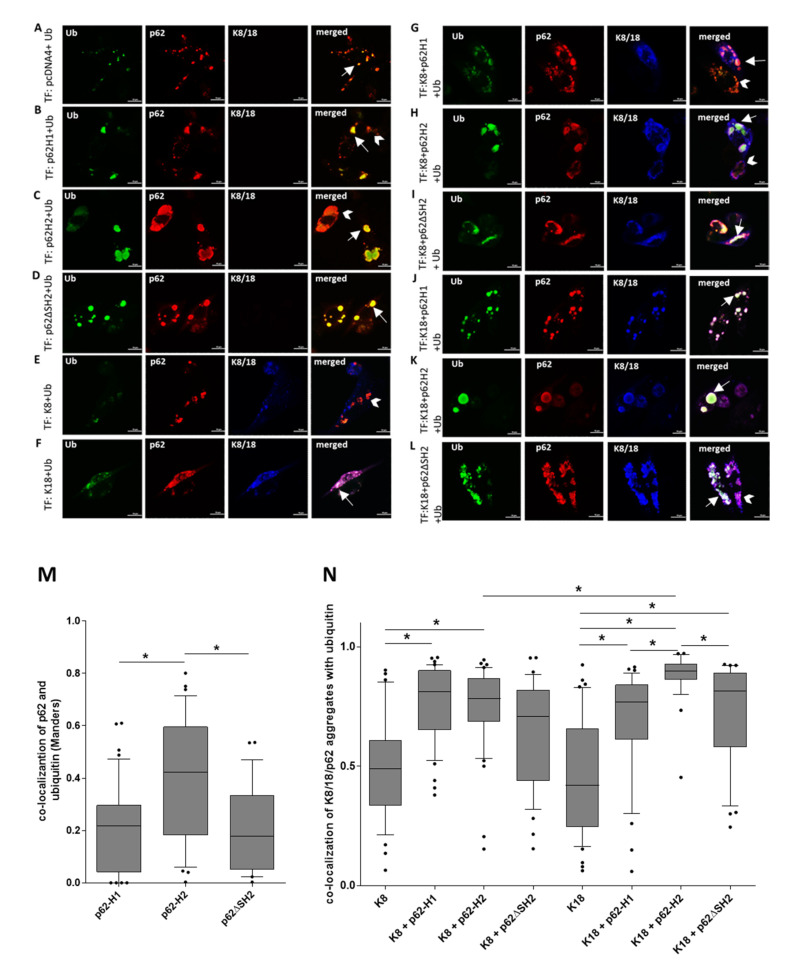
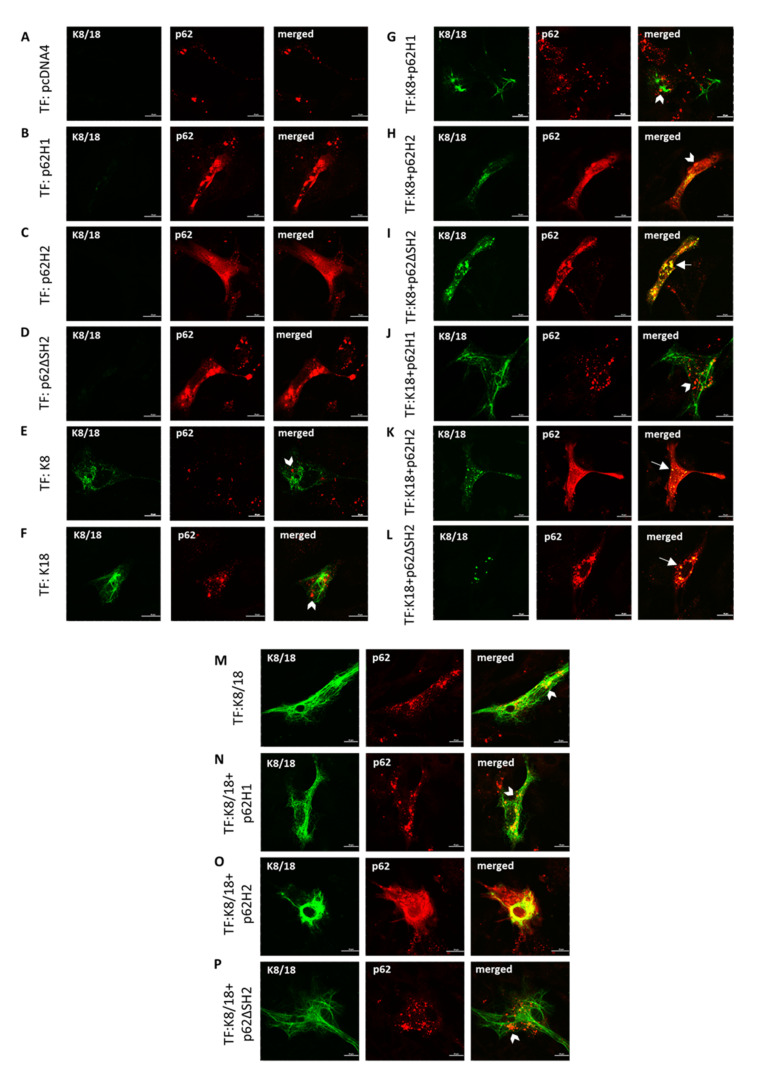
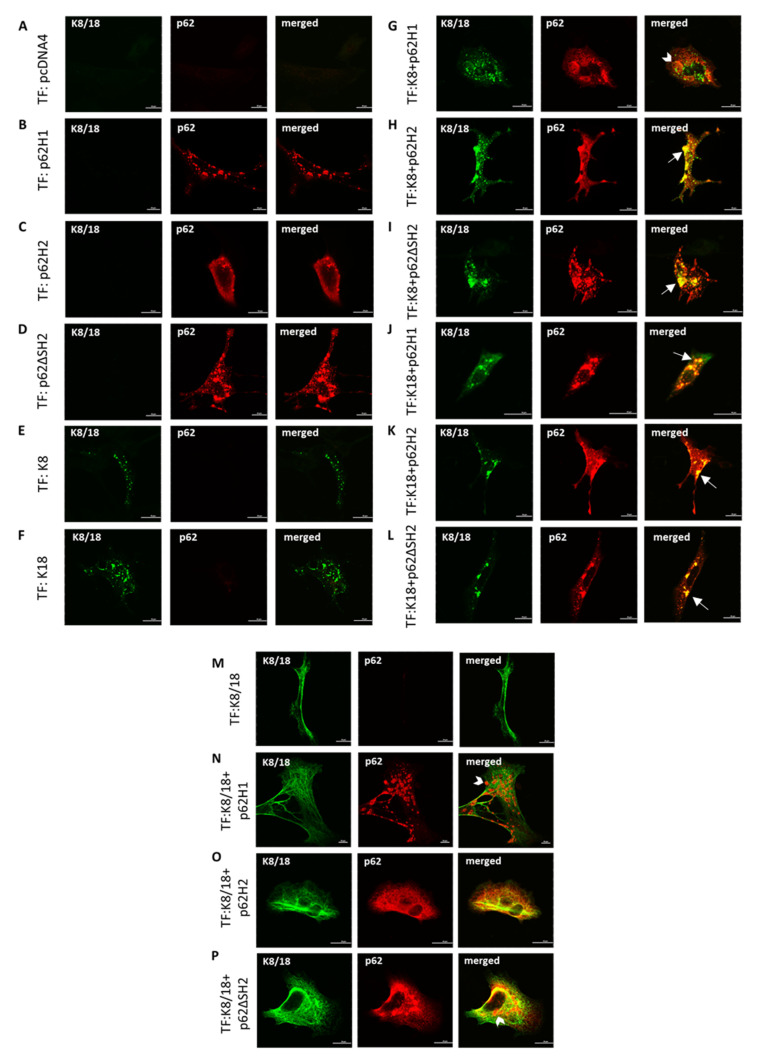
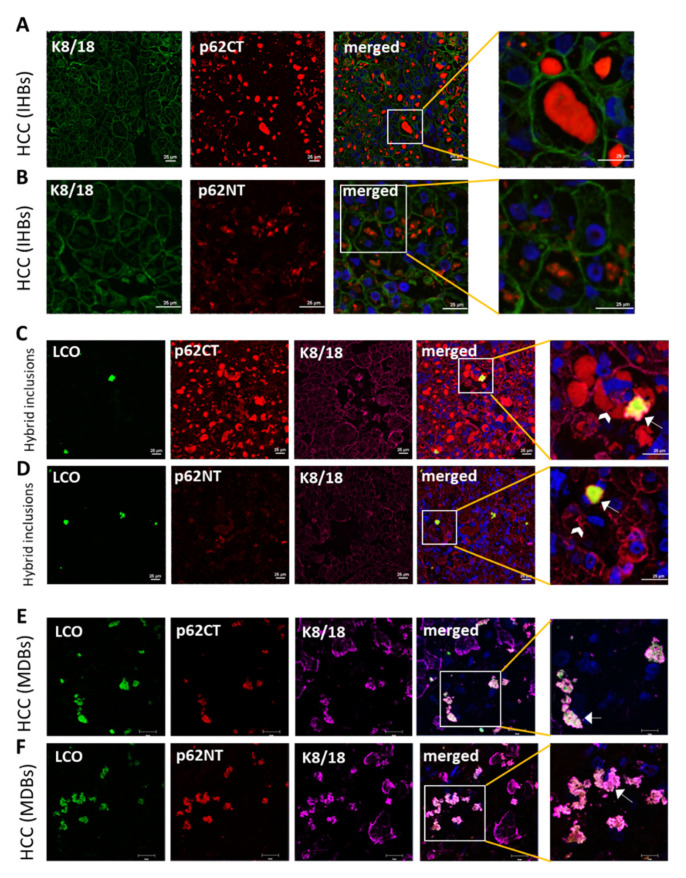
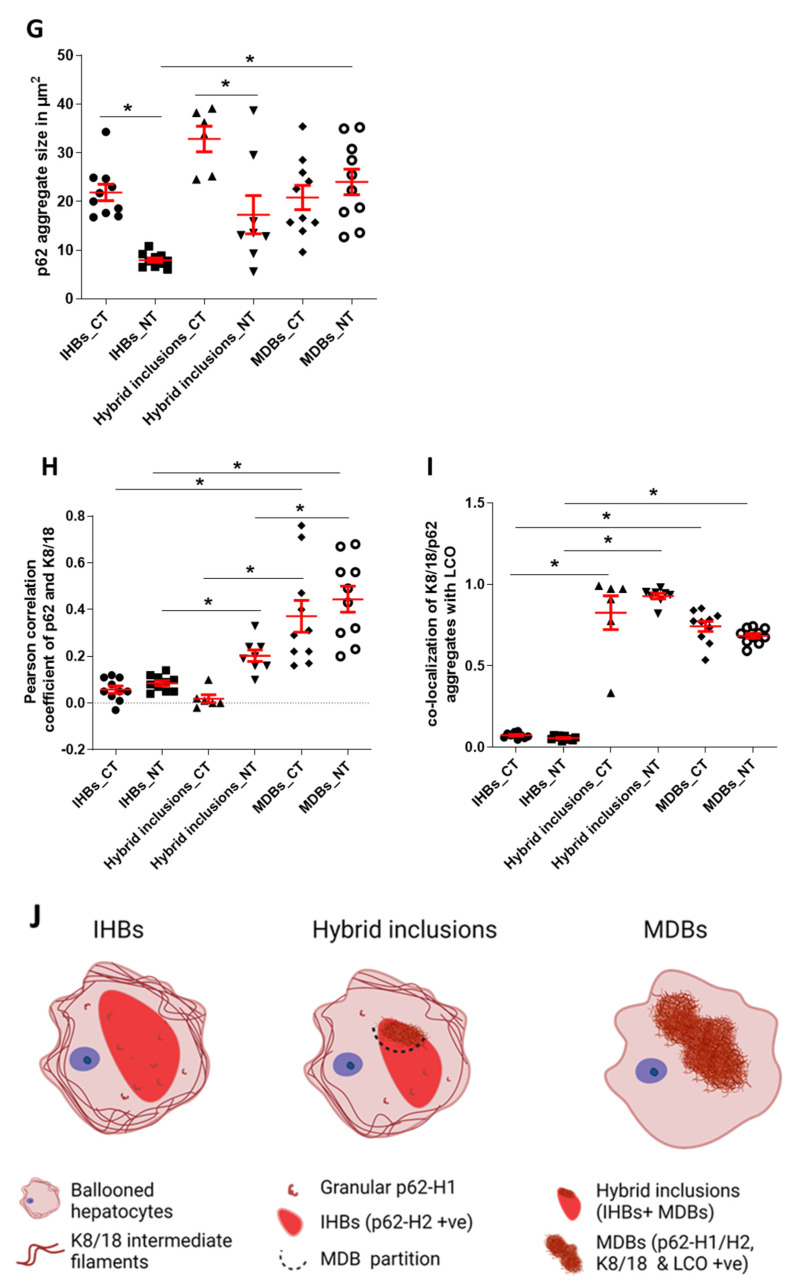
p62/Sequestosome-1 (p62) is a multifunctional adaptor protein and is also a constant component of disease-associated protein aggregates, including Mallory-Denk bodies (MDBs), in steatohepatitis and hepatocellular carcinoma. We investigated the interaction of the two human p62 isoforms, p62-H1 (full-length isoform) and p62-H2 (partly devoid of PB1 domain), with keratins 8 and 18, the major components of MDBs. In human liver, p62-H2 is expressed two-fold higher compared to p62-H1 at the mRNA level and is present in slightly but not significantly higher concentrations at the protein level. Co-transfection studies in CHO-K1 cells, PLC/PRF/5 cells as well as p62- total-knockout and wild-type mouse fibroblasts revealed marked differences in the cytoplasmic distribution and aggregation behavior of the two p62 isoforms. Transfection-induced overexpression of p62-H2 generated large cytoplasmic aggregates in PLC/PRF/5 and CHO-K1 cells that mostly co-localized with transfected keratins resembling MDBs or (transfection without keratins) intracytoplasmic hyaline bodies. In fibroblasts, however, transfected p62-H2 was predominantly diffusely distributed in the cytoplasm. Aggregation of p62-H2 and p62ΔSH2 as well as the interaction with K8 (but not with K18) involves acquisition of cross-β-sheet conformation as revealed by staining with luminescent conjugated oligothiophenes. These results indicate the importance of considering p62 isoforms in protein aggregation disease.

Keywords: keratins; p62 isoforms; protein aggregation; protein aggregation diseases.


Conflict of interest statement

The authors declare no conflict of interest.

Figures

Figure A1
Figure A1
Comparison of the functional domains of human p62 isoforms. (A) Human p62 isoforms domain architecture. (B) Comparison of human p62 isoforms using UniProt and Clustal Omega multiple sequence alignment tools and a qPCR primer design strategy along with the primer sequences and positions. The start of the translation of p62-H2 is indicated in blue.
Figure A2
Figure A2
Standard curve analysis of RT-qPCR for quantification of p62 isoform mRNA expression.
Figure A3
Figure A3
The expression of the p62 isoform in human liver and transfected cells: (A) Western blot using the p62CT antibody, which recognizes both isoforms in three independent human liver samples (40 µg/lane); (B) Western blot using the p62NT antibody that recognizes the full-length p62-H1 but not p62-H2; (CE) Western blots performed with CHO-K1 cells transfected with empty vector or p62-H2 compared with non-transfected cells to assess relative ratios of transfected p62 expression to endogenous p62; (C) Western blots using p62CT antibody and (D) β-tubulin as a reference; (E) densitometric analysis of Western blots (C,D) for p62 isoform concentrations normalized to β-tubulin.
Figure A4
Figure A4
The Impact of p62 isoforms on aggregate properties. The CHO-K1 cells were transiently (co-)transfected (TF) with K8, K18, p62-H1, p62-H2, K8 + p62-H1, K8 + p62-H2, K18 + p62-H1, and K18 + p62-H2 and stained for double-label immunofluorescence microscopy with antibodies against p62 (red) and K8/18 (green). Confocal 3D Z-stacks were used to determine the count per cell, the volume and surface of keratin 8 and 18 as well as endogenous p62 and transiently (co-)transfected p62-H1 and p62-H2 aggregates, respectively. The results shown originate from three independent preparations on three different days (n = 60). The data are shown as scatterplots with each dot representing the weighted mean of all cells within each imaged Z-stack with the global mean +/− SEM in red. Using the Kolmogorov–Smirnov test for normality, the results were found to be not normally distributed. Accordingly, significant differences were assessed via repeated Kruskal–Wallis tests and presented as specific p-values (* p ≤ 0.05).
Figure 1
Figure 1
Predominantly expressed p62 isoforms in the human liver. (A) mRNA expression of p62 isoform-1 (p62TV1) and p62 isoform-1, 2, and 3 (p62TV123) normalized to β-actin. Inter-plate calibration and normalization of primer efficiencies using MultiD software. (B) Western blot and densitometric quantification of p62 isoform proteins p62H1 and p62-H2 in three independent human liver samples (40 µg/lane) normalized to β-tubulin (Lane 1: protein ladder, 2–4: human liver samples). Immunoblotting using the p62CT antibody that recognizes both isoforms. A paired student’s t-test was performed to evaluate significance, ns p > 0.05, ** p < 0.05.
Figure 2
Figure 2
The p62-H2 formed large aggregates and co-localized with K18 in the CHO-K1 cells. The CHO-K1 cells were transiently (co-)transfected (TF) with (A) empty vector (pcDNA4), (B) p62 isoform1 (p62-H1), (C) p62 isoform2 (p62-H2), (D) p62ΔSH2 mutant, (E) keratin 8 (K8), (F) keratin 18 (K18), (G) p62-H1 and K8, (H) p62-H2 and K8, (I) p62ΔSH2 and K8, (J) p62-H1 and K18, (K) p62-H2 and K18, and (L) p62ΔSH2 and K18. Transfected cells were stained for double-label immunofluorescence microscopy with antibodies against p62 (red) and K8/18 (green). Arrows indicate examples of aggregates showing co-localization of p62 and keratin; arrowheads indicate no co-localization. Scale bar = 20 μm. (M) The average size of the aggregates in the 130–170 cells/experiment, derived from three independent transfections (n = 3), was analyzed using ImageJ software, and the individual aggregate size was assessed. Accordingly, significant differences were assessed by comparing the average aggregate size of p62-H1, p62-H2, and p62ΔSH2 and endogenous p62 (i.e., stress bodies; transfected with empty vector) using one-way ANOVA and Tukey’s multiple comparisons and presented as specific p-values (* p ≤ 0.05, ** p ≤ 0.01).
Figure 3
Figure 3
Pronounced molecular interaction of keratins with p62-H2. The CHO-K1 cells were transiently co-transfected (TF) with K8, K18, p62-H1 and K8, p62-H2 and K8, p62-H1 and K18, and p62-H2 and K18 and were stained for double-label immunofluorescence microscopy with antibodies against p62 (red) and K8/18 (green). (A) Representative slides of confocal Z-stacks are shown for each condition. (C) Co-localization analysis of confocal Z-stacks using the Pearson correlation coefficient of the specimens is shown in a large number of cells (K8, n = 65; K8 + p62H1, n = 100; K8 + p62H2, n = 93; K18, n = 139; K18 + p62H1, n = 124; K18 + p62H2, n = 128). (B) Specimens shown in (A) were imaged using a widefield FRET system. Representative images for all conditions are shown for p62-labeled (red) and K8/18 (green), and additional FRET acquired signals are shown in pseudo-color. (D) Close molecular interaction between K8 and K18, respectively, with endogenous or transiently co-transfected p62-H1 or p62-H2 (K8, n = 169; K8 + p62H1, n = 187; K8 + p62H2, n = 160; K18, n = 199; K18 + p62H1, n = 202; K18 + p62H2, n = 193) using a FRET setup. Single-cell data are shown as scatterplots with mean +/–SEM in red. The results originate from three independent preparations performed on three different days. Using the Kolmogorov–Smirnov test for normality, the results showed no normal distribution. Significant differences were assessed by repeated Kruskal–Wallis tests and Dunn’s multiple comparison tests and presented as specific p-values (* p ≤ 0.05).
Figure 4
Figure 4
Cross-β-sheet conformation in aggregates demonstrated by using LCO. The CHO-K1 cells were transiently co-transfected (TF) with (A) empty vector (pcDNA4), (B) p62 isoform1 (p62-H1), (C) p62 isoform2 (p62-H2), (D) p62ΔSH2 mutant, (E) keratin 8 (K8), (F) keratin 18 (K18), (G) p62-H1 and K8, (H) p62-H2 and K8, (I) p62ΔSH2 and K8, (J) p62-H1 and K18, (K) p62-H2 and K18, and (L) p62ΔSH2 and K18, and all were stained for triple-label immunofluorescence microscopy with antibodies against p62 (red), K8/18 (magenta), and LCO dye (green). Arrows indicate examples of aggregates showing co-localization of p62 and keratin with an LCO-fluorescence signal; arrowheads indicate examples of no co-localization. Scale bar = 20 μm. (M) Co-localization of p62-H1, p62-H2 or p62∆SH2 with LCO-fluorescence in protein aggregates of two independent experiments shown in (B–D) (p62-H1, n = 34; p62-H2, n = 41; p62ΔSH2, n = 41). (N) Triple co-localization analysis of K8/18 and p62 overlaying clusters with LCO fluorescence of the specimens shown in (EL) (K8, n = 30; K8 + p62-H1, n = 25; K8 + p62-H2, n = 30; K8 + p62ΔSH2, n = 32; K18, n = 35; K18 + p62-H1, n = 32; K18 + p62-H2, n = 45; K18 + p62ΔSH2, n = 38). Single-cell data are shown as boxplots. Horizontal lines represent the median, the lower and upper hinges show the first quartile and third quartile, and the lower and upper whiskers encompass 10% and 90% of values. Outliers are marked as dots. Using the Kolmogorov–Smirnov test for normality, the results showed no normal distribution. Significant differences were assessed by repeated Kruskal–Wallis tests and Dunn’s multiple comparison tests and presented as specific p-values (* p ≤ 0.05).
Figure 4
Figure 4
Cross-β-sheet conformation in aggregates demonstrated by using LCO. The CHO-K1 cells were transiently co-transfected (TF) with (A) empty vector (pcDNA4), (B) p62 isoform1 (p62-H1), (C) p62 isoform2 (p62-H2), (D) p62ΔSH2 mutant, (E) keratin 8 (K8), (F) keratin 18 (K18), (G) p62-H1 and K8, (H) p62-H2 and K8, (I) p62ΔSH2 and K8, (J) p62-H1 and K18, (K) p62-H2 and K18, and (L) p62ΔSH2 and K18, and all were stained for triple-label immunofluorescence microscopy with antibodies against p62 (red), K8/18 (magenta), and LCO dye (green). Arrows indicate examples of aggregates showing co-localization of p62 and keratin with an LCO-fluorescence signal; arrowheads indicate examples of no co-localization. Scale bar = 20 μm. (M) Co-localization of p62-H1, p62-H2 or p62∆SH2 with LCO-fluorescence in protein aggregates of two independent experiments shown in (B–D) (p62-H1, n = 34; p62-H2, n = 41; p62ΔSH2, n = 41). (N) Triple co-localization analysis of K8/18 and p62 overlaying clusters with LCO fluorescence of the specimens shown in (EL) (K8, n = 30; K8 + p62-H1, n = 25; K8 + p62-H2, n = 30; K8 + p62ΔSH2, n = 32; K18, n = 35; K18 + p62-H1, n = 32; K18 + p62-H2, n = 45; K18 + p62ΔSH2, n = 38). Single-cell data are shown as boxplots. Horizontal lines represent the median, the lower and upper hinges show the first quartile and third quartile, and the lower and upper whiskers encompass 10% and 90% of values. Outliers are marked as dots. Using the Kolmogorov–Smirnov test for normality, the results showed no normal distribution. Significant differences were assessed by repeated Kruskal–Wallis tests and Dunn’s multiple comparison tests and presented as specific p-values (* p ≤ 0.05).
Figure 5
Figure 5
Keratin-8 and keratin-18 co-aggregation with p62-H1 was enhanced by ubiquitin. The CHO-K1 cells were transiently (co-)transfected (TF) with ubiquitin in combination with (A) empty vector (pcDNA4), (B) p62 isoform1 (p62-H1), (C) p62 isoform2 (p62-H2), (D) p62ΔSH2 mutant, (E) keratin 8 (K8), (F) keratin 18 (K18), (G) p62-H1 and K8, (H) p62-H2 and K8, (I) p62ΔSH2 and K8, (J) p62-H1 and K18, (K) p62-H2 and K18, and (L) p62ΔSH2 and K18, and all were stained for triple-label immunofluorescence microscopy with antibodies against ubiquitin (green), p62 (red), and K8/18 (magenta). Arrows indicate examples of aggregates showing co-localization of p62 and keratin with ubiquitin; arrowheads indicate examples of no co-localization. Scale bar = 20 μm. (M) Co-localization of p62-H1, p62-H2, or p62∆SH2 with ubiquitin in protein aggregates of two independent experiments shown in (BD) (p62-H1, n = 41; p62-H2, n = 34; p62ΔSH2, n = 25). (N) Triple co-localization analysis of K8/18 and p62 overlaying clusters with ubiquitin staining is shown in (E-L) (K8, n = 33; K8 + p62-H1, n = 42; K8 + p62-H2, n = 40; K8 + p62ΔSH2, n = 37; K18, n = 46; K18 + p62-H1, n = 39; K18 + p62-H2, n = 27; K18 + p62ΔSH2, n = 32). Single cell data are shown as boxplots. Horizontal lines represent the median, the lower and upper hinges show, respectively, the first quartile and the third quartile, and the lower and upper whiskers encompass 10% and 90% of values. Outliers are marked as dots. Using the Kolmogorov–Smirnov test for normality, the results showed no normal distribution. Significant differences were assessed by repeated Kruskal–Wallis tests and Dunn’s multiple comparison tests and presented as specific p-values (* p ≤ 0.05).
Figure 6
Figure 6
The p62-H2 formed large aggregates and interacted with aggregates of overexpressed K8 and K18 but not with intermediate filaments in PLC/PRF/5 cells. The PLC/PRF/5 cells were transiently (co-)transfected (TF) with (A) empty vector (pcDNA4), (B) p62 isoform1 (p62-H1), (C) p62 isoform2 (p62-H2), (D) p62ΔSH2 mutant, (E) keratin 8 (K8), (F) keratin 18 (K18), (G) p62-H1 and K8, (H) p62-H2 and K8, (I) p62ΔSH2 and K8, (J) p62-H1 and K18 (K), p62-H2 and K18, and (L) p62ΔSH2 and K18, and all were stained for double-label immunofluorescence microscopy with antibodies against p62 (red) and K8/18 (green). Two independent experimental series were performed. Arrows indicate examples of aggregates showing co-localization of p62 and keratin; arrowheads indicate examples of no co-localization. Scale bar = 20 μm.
Figure 7
Figure 7
The p62-H2 was diffusely distributed and formed aggregates only in the presence of either K8 or K18 but not of keratin intermediate filaments in p62flox MEFs. Isolated p62flox fibroblasts were transiently (co-)transfected with (A) empty vector (pcDNA4), (B) p62 isoform1 (p62-H1), (C) p62 isoform2 (p62-H2), (D) p62ΔSH2 mutant, (E) keratin 8 (K8), (F) keratin 18 (K18), (G) p62-H1 and K8, (H) p62-H2 and K8, (I) p62ΔSH2 and K8, (J) p62-H1 and K18, (K) p62-H2 and K18, (L) p62ΔSH2 and K18, (M) K8 and K18, (N) p62-H1, K8 and K18, (O) p62-H2, K8, and K18, and (P) p62ΔSH2, K8 and K18, and all were stained for double-label immunofluorescence microscopy with antibodies against p62 (red) and K8/18 (green). Two independent experimental series were performed. Arrows indicate examples of aggregates showing co-localization of p62 and keratin; arrowheads indicate examples of no co-localization. Scale bar = 20 μm.
Figure 8
Figure 8
Interaction of p62-H2 with keratin was independent of endogenous p62 in p62KO MEFs. Isolated p62KO MEFs were transiently (co-)transfected with (A) empty vector (pcDNA4), (B) p62 isoform1 (p62-H1), (C) p62 isoform2 (p62H2), (D) p62ΔSH2 mutant, (E) keratin 8 (K8), (F) keratin 18 (K18), (G) p62-H1 and K8, (H) p62-H2 and K8, (I) p62ΔSH2 and K8, (J) p62-H1 and K18, (K) p62-H2 and K18, (L) p62ΔSH2 and K18, (M) K8 and K18, (N) p62-H1, K8, and K18, (O) p62-H2, K8, and K18, and (P) p62ΔSH2, K8, and K18, and all were stained for double-label immunofluorescence microscopy with antibodies against p62 (red) and K8/18 (green). Two independent experimental series were performed. Arrows indicate examples of aggregates showing co-localization of p62 and keratin; arrowheads indicate examples of no co-localization. Scale bar = 20 μm.
Figure 9
Figure 9
The p62-H2 contributed to IHB formation in human HCC. Frozen tissue sections from human HCC were stained for double-label immunofluorescence microscopy with antibodies against the (A) C-terminus (p62CT) or the (B) N-terminus (p62NT) of p62 (red) combined with K8/18 labeling (green) and DAPI (blue) staining. (C,D) HCC containing IHBs and hybrid inclusions were stained for triple-label immunofluorescence microscopy with antibodies against p62CT (red in C) or p62NT (red in D) and K8/18 (magenta in C and D) and the LCO dye (green) and DAPI (blue). (C,D) The arrows indicate aggregate with co-localization of p62, keratins, and an LCO fluorescence signal as characteristic of a hybrid lesion, (C) whereas the arrowheads denote IHBs containing only p62-H2 and (D) granular p62-H1. (E,F) HCCs containing MDBs were stained for triple-label immunofluorescence microscopy with antibodies against p62CT (red in E) or p62NT (red in F) and K8/18 (magenta in E and F) and the LCO dye (green) and DAPI (blue). (E,F) The arrows indicate aggregate with co-localization of p62, keratins, and an LCO fluorescence signal as characteristic of MDBs. Scale bar = 25 μm. (G) Analysis of p62 aggregate size in IHBs, hybrid inclusions, and MDB samples labeled for p62CT (CT) or p62NT (NT) (IHB_CT, n = 10; IHB_NT, n = 10; MDB_CT, n = 10; MDB_NT, n = 10; Hybrid_CT, n = 6; Hybrid_NT, n = 8). (H) Co-localization of p62CT (CT) or p62NT (NT) with K8/18 in IHB, hybrid inclusions, and MDB samples (IHB_CT, n = 10; IHB_NT, n = 10; MDB_CT, n = 10; MDB_NT, n = 10; Hybrid_CT, n = 6; Hybrid_NT, n = 8). (I) Triple co-localization analysis of K8/18 and p62CT/NT overlaying aggregates with LCO staining in IHB, hybrid inclusions, and MDB samples (IHB_CT, n = 10; IHB_NT, n = 10; MDB_CT, n = 10; MDB_NT, n = 10; Hybrid_CT, n = 6; Hybrid_NT, n = 8). Single-image data are shown as scatterplot with mean +/–SEM in red. Using the Kolmogorov–Smirnov test for normality, the results showed normal distribution. Significant differences were assessed by ANOVA and Bonferroni post hoc tests and presented as specific p-values (* p ≤ 0.05). (J) Schematic drawing of the distinctive roles of p62 isoforms involved in IHBs, hybrid inclusions, and MDB formation.
Figure 9
Figure 9
The p62-H2 contributed to IHB formation in human HCC. Frozen tissue sections from human HCC were stained for double-label immunofluorescence microscopy with antibodies against the (A) C-terminus (p62CT) or the (B) N-terminus (p62NT) of p62 (red) combined with K8/18 labeling (green) and DAPI (blue) staining. (C,D) HCC containing IHBs and hybrid inclusions were stained for triple-label immunofluorescence microscopy with antibodies against p62CT (red in C) or p62NT (red in D) and K8/18 (magenta in C and D) and the LCO dye (green) and DAPI (blue). (C,D) The arrows indicate aggregate with co-localization of p62, keratins, and an LCO fluorescence signal as characteristic of a hybrid lesion, (C) whereas the arrowheads denote IHBs containing only p62-H2 and (D) granular p62-H1. (E,F) HCCs containing MDBs were stained for triple-label immunofluorescence microscopy with antibodies against p62CT (red in E) or p62NT (red in F) and K8/18 (magenta in E and F) and the LCO dye (green) and DAPI (blue). (E,F) The arrows indicate aggregate with co-localization of p62, keratins, and an LCO fluorescence signal as characteristic of MDBs. Scale bar = 25 μm. (G) Analysis of p62 aggregate size in IHBs, hybrid inclusions, and MDB samples labeled for p62CT (CT) or p62NT (NT) (IHB_CT, n = 10; IHB_NT, n = 10; MDB_CT, n = 10; MDB_NT, n = 10; Hybrid_CT, n = 6; Hybrid_NT, n = 8). (H) Co-localization of p62CT (CT) or p62NT (NT) with K8/18 in IHB, hybrid inclusions, and MDB samples (IHB_CT, n = 10; IHB_NT, n = 10; MDB_CT, n = 10; MDB_NT, n = 10; Hybrid_CT, n = 6; Hybrid_NT, n = 8). (I) Triple co-localization analysis of K8/18 and p62CT/NT overlaying aggregates with LCO staining in IHB, hybrid inclusions, and MDB samples (IHB_CT, n = 10; IHB_NT, n = 10; MDB_CT, n = 10; MDB_NT, n = 10; Hybrid_CT, n = 6; Hybrid_NT, n = 8). Single-image data are shown as scatterplot with mean +/–SEM in red. Using the Kolmogorov–Smirnov test for normality, the results showed normal distribution. Significant differences were assessed by ANOVA and Bonferroni post hoc tests and presented as specific p-values (* p ≤ 0.05). (J) Schematic drawing of the distinctive roles of p62 isoforms involved in IHBs, hybrid inclusions, and MDB formation.

References

    1. Pankiv S., Clausen T.H., Lamark T., Brech A., Bruun J.A., Outzen H., Øvervatn A., Bjørkøy G., Johansen T. p62/SQSTM1 binds directly to Atg8/LC3 to facilitate degradation of ubiquitinated protein aggregates by autophagy*[S] J. Biol. Chem. 2007;282:24131–24145. doi: 10.1074/jbc.M702824200. - DOI - PubMed
    1. Zhong Z., Umemura A., Sanchez-Lopez E., Liang S., Shalapour S., Wong J., He F., Boassa D., Perkins G., Ali S.R., et al. NF-κB Restricts Inflammasome Activation via Elimination of Damaged Mitochondria. Cell. 2016;164:896–910. doi: 10.1016/j.cell.2015.12.057. - DOI - PMC - PubMed
    1. Carroll B., Otten E.G., Manni D., Stefanatos R., Menzies F.M., Smith G.R., Jurk D., Kenneth N., Wilkinson S., Passos J.F., et al. Oxidation of SQSTM1/p62 mediates the link between redox state and protein homeostasis. Nat. Commun. 2018;9:1–11. doi: 10.1038/s41467-017-02746-z. - DOI - PMC - PubMed
    1. Zhang R., Varela M., Vallentgoed W., Forn-Cuni G., van der Vaart M., Meijer A.H. The selective autophagy receptors Optineurin and p62 are both required for zebrafish host resistance to mycobacterial infection. PLoS Pathog. 2019;15:e1007329. doi: 10.1371/journal.ppat.1007329. - DOI - PMC - PubMed
    1. Saito T., Ichimura Y., Taguchi K., Suzuki T., Mizushima T., Takagi K., Hirose Y., Nagahashi M., Iso T., Fukutomi T., et al. P62/Sqstm1 promotes malignancy of HCV-positive hepatocellular carcinoma through Nrf2-dependent metabolic reprogramming. Nat. Commun. 2016;7:1–16. doi: 10.1038/ncomms12030. - DOI - PMC - PubMed